The South Korean Economy in the 1970s faced a choice between Consumption and Investment. This trade-off followed the normal situation of decreasing marginal returns/increasing costs. Which of the following three figures would best depict the PPF showing this original situation of decreasing marginal returns/increasing costs for South Korea in the 1970s? (note: you can access a larger and more user friendly pdf version of the image using the link in the opening discussion above). PPF Problem Graph - Microeconomics Summer 2021 FIGURE C FIGURE B FIGURE A 100 25 15 20 65 65 65 B OD 15 10 10 Consumption Consumption Consumption O Figure B O Figure A Investment Investment
The South Korean Economy in the 1970s faced a choice between Consumption and Investment. This trade-off followed the normal situation of decreasing marginal returns/increasing costs. Which of the following three figures would best depict the PPF showing this original situation of decreasing marginal returns/increasing costs for South Korea in the 1970s? (note: you can access a larger and more user friendly pdf version of the image using the link in the opening discussion above). PPF Problem Graph - Microeconomics Summer 2021 FIGURE C FIGURE B FIGURE A 100 25 15 20 65 65 65 B OD 15 10 10 Consumption Consumption Consumption O Figure B O Figure A Investment Investment

Economics Today and Tomorrow, Student Edition
1st Edition
ISBN:9780078747663
Author:McGraw-Hill
Publisher:McGraw-Hill
Chapter10: Financing And Producing Goods
Section: Chapter Questions
Problem 8AA

Related questions
Question
Figure a or b or c

Transcribed Image Text:Take Quiz
Exit
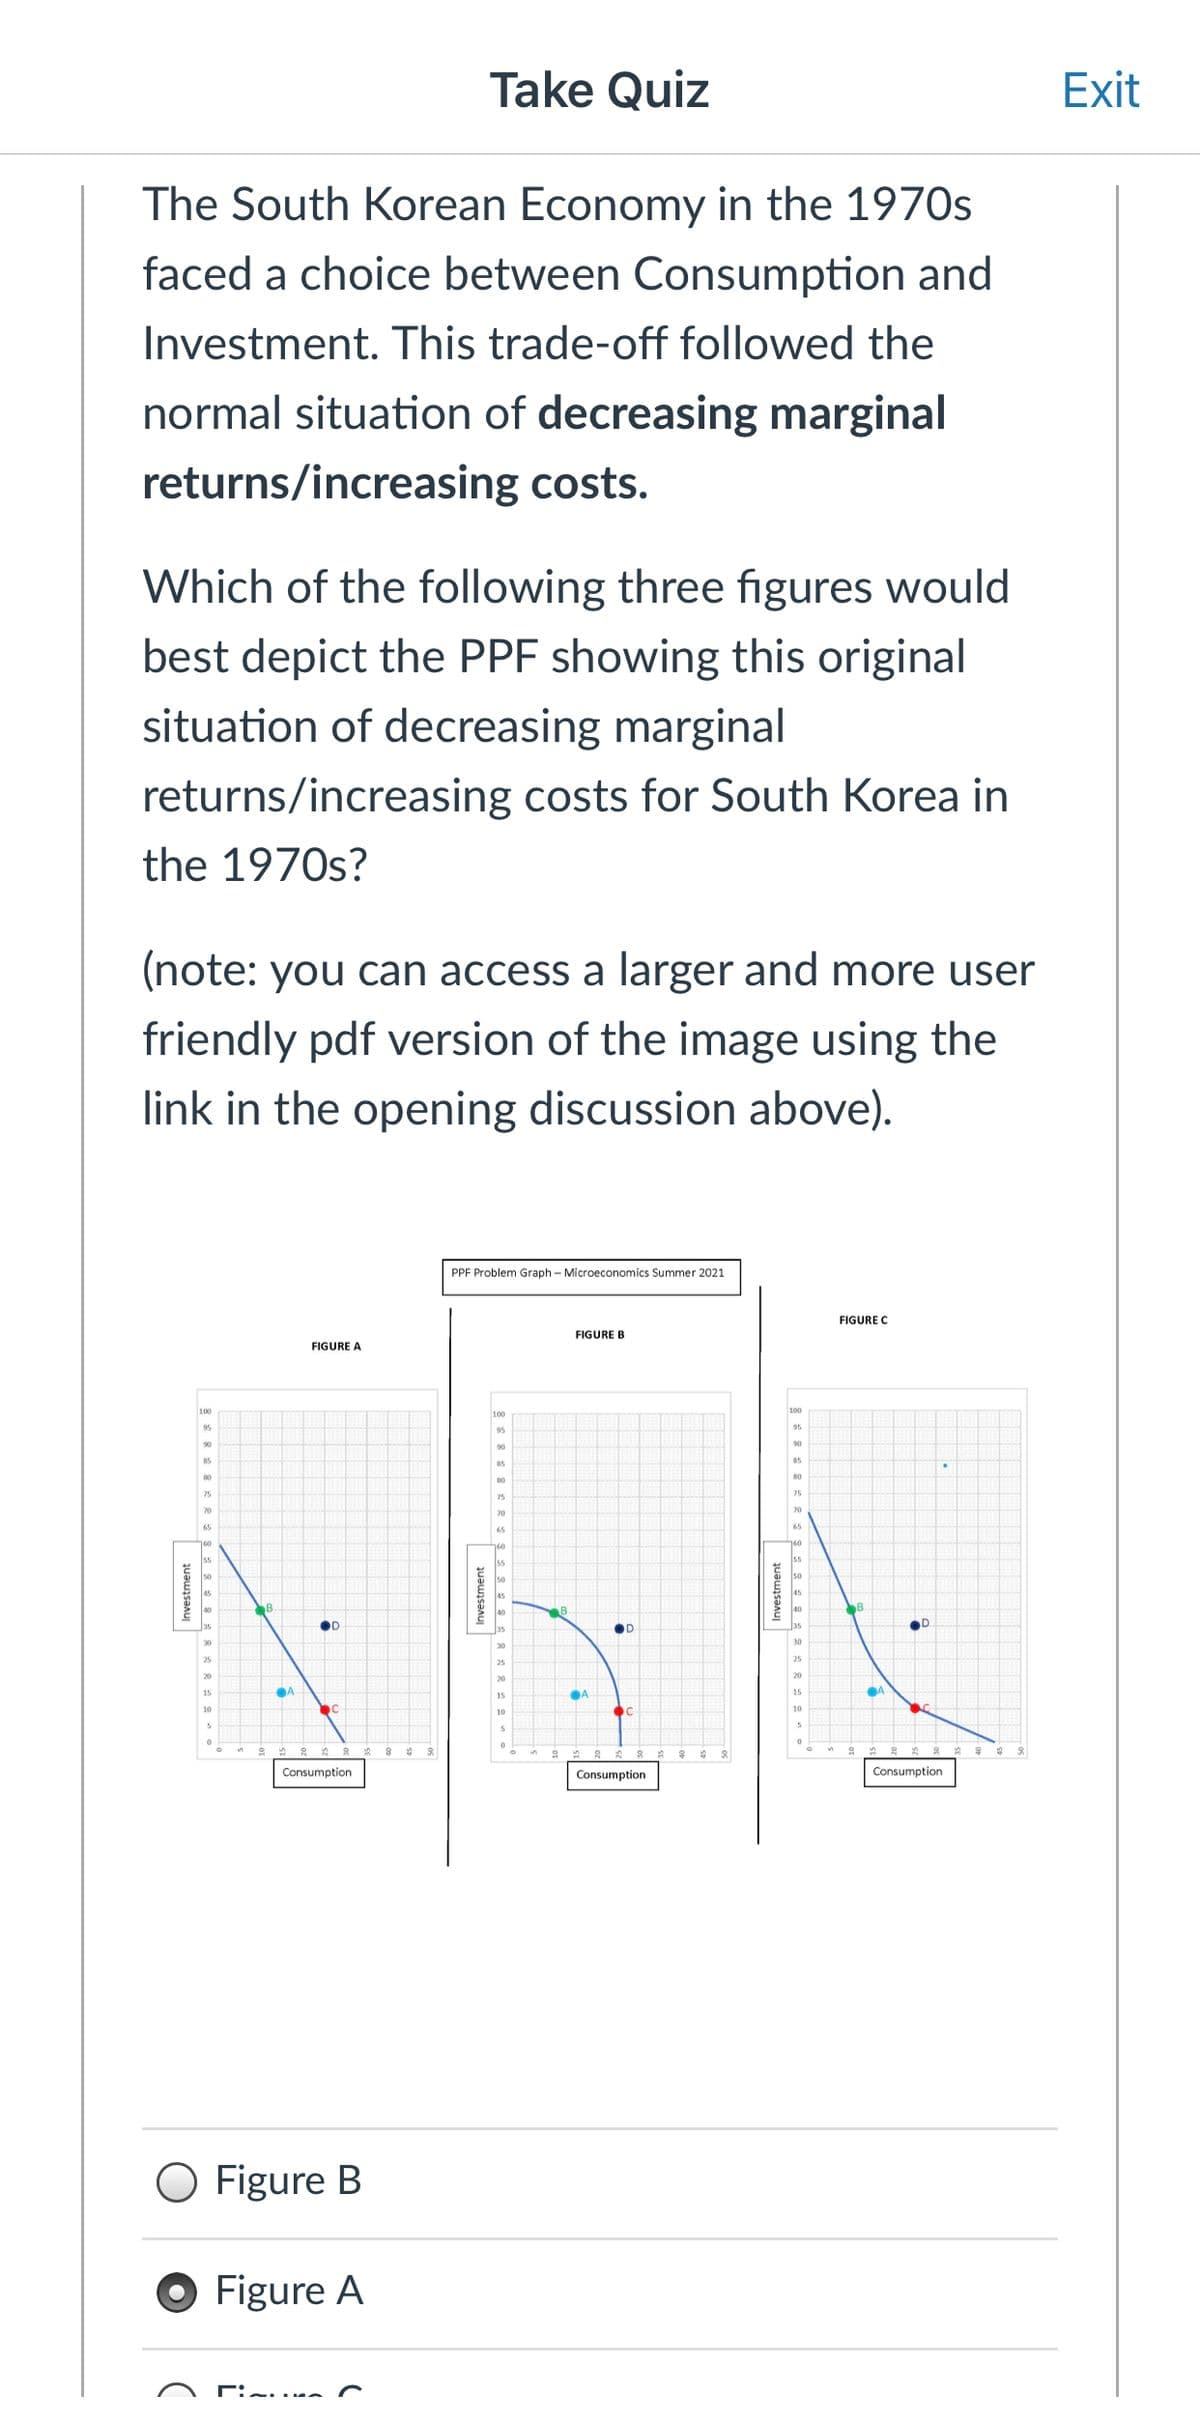
The South Korean Economy in the 1970s
faced a choice between Consumption and
Investment. This trade-off followed the
normal situation of decreasing marginal
returns/increasing costs.
Which of the following three figures would
best depict the PPF showing this original
situation of decreasing marginal
returns/increasing costs for South Korea in
the 1970s?
(note: you can access a larger and more user
friendly pdf version of the image using the
link in the opening discussion above).
PPF Problem Graph – Microeconomics Summer 2021
FIGURE C
FIGURE B
FIGURE A
100
100
95
95
90
90
90
85
85
80
80
75
75
75
70
OD
25
20
20
15
A
15
15
10
10
5.
Consumption
Consumption
Consumption
O Figure B
Figure A
Investment
Investment
Investment
Expert Solution
This question has been solved!
Explore an expertly crafted, step-by-step solution for a thorough understanding of key concepts.

This is a popular solution!

Trending now
This is a popular solution!

Step by step
Solved in 2 steps

Knowledge Booster


Learn more about
Need a deep-dive on the concept behind this application? Look no further. Learn more about this topic, economics and related others by exploring similar questions and additional content below.Recommended textbooks for you
Economics Today and Tomorrow, Student Edition
Economics
ISBN:
9780078747663
Author:
McGraw-Hill
Publisher:
Glencoe/McGraw-Hill School Pub Co
Economics Today and Tomorrow, Student Edition
Economics
ISBN:
9780078747663
Author:
McGraw-Hill
Publisher:
Glencoe/McGraw-Hill School Pub Co