The boxplot below shows salaries for Construction workers and Teachers. Construction Teacher 23 24 25 26 27 28 29 30 31 32 33 34 35 36 37 38 39 40 41 42 Salary (thousands of $) Jennie makes the first quartile salary for a construction worker. Markos makes the first quartile salary for a teacher. Who makes more money? O Markos O Jennie How much more? $
The boxplot below shows salaries for Construction workers and Teachers. Construction Teacher 23 24 25 26 27 28 29 30 31 32 33 34 35 36 37 38 39 40 41 42 Salary (thousands of $) Jennie makes the first quartile salary for a construction worker. Markos makes the first quartile salary for a teacher. Who makes more money? O Markos O Jennie How much more? $

Functions and Change: A Modeling Approach to College Algebra (MindTap Course List)
6th Edition
ISBN:9781337111348
Author:Bruce Crauder, Benny Evans, Alan Noell
Publisher:Bruce Crauder, Benny Evans, Alan Noell
Chapter5: A Survey Of Other Common Functions
Section5.3: Modeling Data With Power Functions
Problem 6E: Urban Travel Times Population of cities and driving times are related, as shown in the accompanying...

Related questions
Question
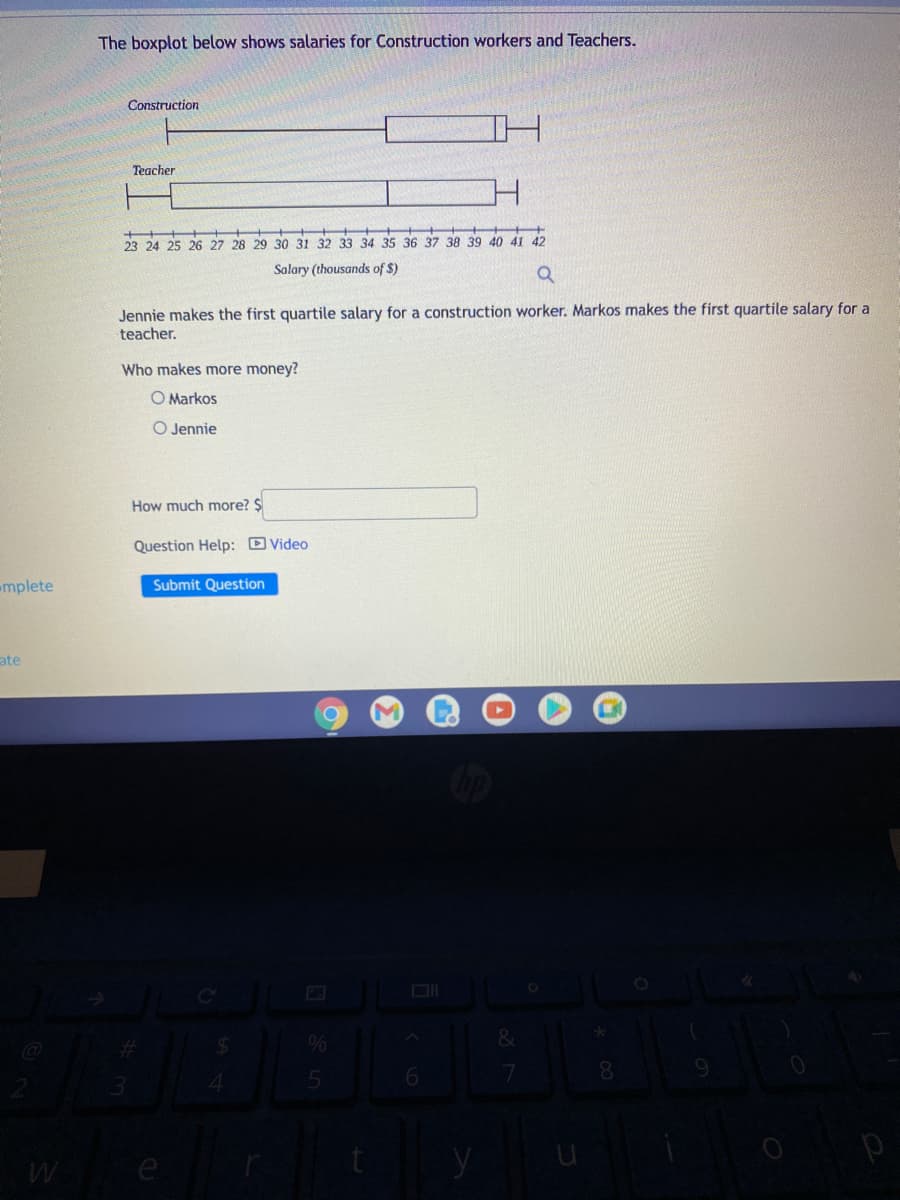
Transcribed Image Text:The boxplot below shows salaries for Construction workers and Teachers.
Construction
Teacher
23 24 25 26 27 28 29 30 31 32 33 34 35 36 37 38 39 40 41 42
Salary (thousands of $)
Jennie makes the first quartile salary for a construction worker. Markos makes the first quartile salary for a
teacher.
Who makes more money?
O Markos
O Jennie
How much more? $
Question Help: D Video
mplete
Submit Question
ate
%
e
Expert Solution
This question has been solved!
Explore an expertly crafted, step-by-step solution for a thorough understanding of key concepts.

This is a popular solution!

Trending now
This is a popular solution!

Step by step
Solved in 2 steps

Recommended textbooks for you
Functions and Change: A Modeling Approach to Coll…
Algebra
ISBN:
9781337111348
Author:
Bruce Crauder, Benny Evans, Alan Noell
Publisher:
Cengage Learning
Functions and Change: A Modeling Approach to Coll…
Algebra
ISBN:
9781337111348
Author:
Bruce Crauder, Benny Evans, Alan Noell
Publisher:
Cengage Learning