Bus and subway ridership for the summer months in London, England, is believed to be tied heavily to the number of tourists visiting the city. During the past 12 years, the following data have been obtained: Year 1 3 4 6 7 8 9 10 11 12 Number of Tourists (in millions) 7 2 4 14 15 16 12 14 20 15 Ridership (in millions) 1.5 0.9 1.3 1.6 2.4 2.8 2.5 2.1 2.7 4.4 3.3 1.
Bus and subway ridership for the summer months in London, England, is believed to be tied heavily to the number of tourists visiting the city. During the past 12 years, the following data have been obtained: Year 1 3 4 6 7 8 9 10 11 12 Number of Tourists (in millions) 7 2 4 14 15 16 12 14 20 15 Ridership (in millions) 1.5 0.9 1.3 1.6 2.4 2.8 2.5 2.1 2.7 4.4 3.3 1.

Functions and Change: A Modeling Approach to College Algebra (MindTap Course List)
6th Edition
ISBN:9781337111348
Author:Bruce Crauder, Benny Evans, Alan Noell
Publisher:Bruce Crauder, Benny Evans, Alan Noell
Chapter5: A Survey Of Other Common Functions
Section5.6: Higher-degree Polynomials And Rational Functions
Problem 5E: Population Genetics In the study of population genetics, an important measure of inbreeding is the...

Related questions
Question
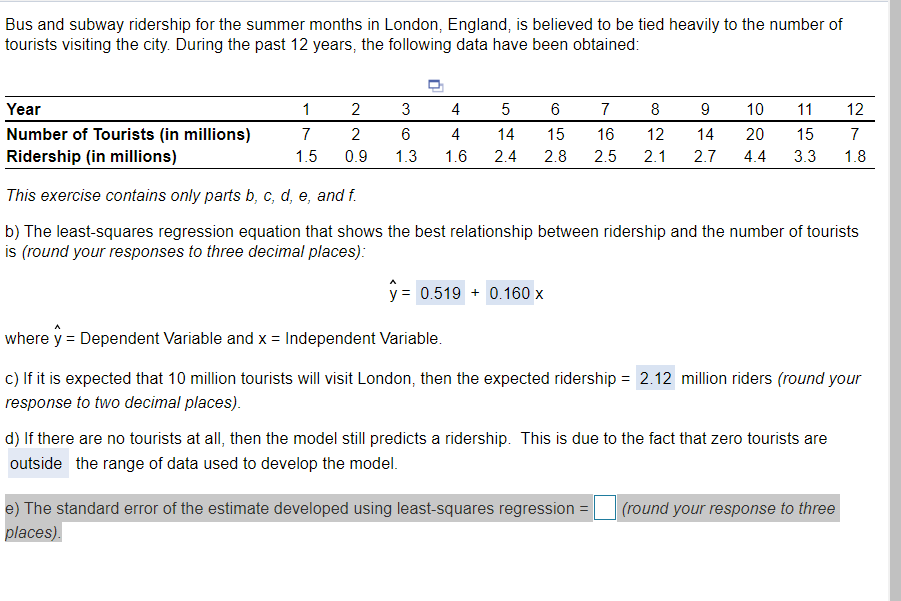
Transcribed Image Text:Bus and subway ridership for the summer months in London, England, is believed to be tied heavily to the number of
tourists visiting the city. During the past 12 years, the following data have been obtained:
Year
1
2
3
4
6
7
8
9
10
11
12
Number of Tourists (in millions)
7
2
4
14
15
16
12
14
20
15
7
Ridership (in millions)
1.5
0.9
1.3
1.6
2.4
2.8
2.5
2.1
2.7
4.4
3.3
1.8
This exercise contains only parts b, c, d, e, and f.
b) The least-squares regression equation that shows the best relationship between ridership and the number of tourists
is (round your responses to three decimal places):
y = 0.519 + 0.160 x
where y = Dependent Variable and x = Independent Variable.
c) If it is expected that 10 million tourists will visit London, then the expected ridership = 2.12 million riders (round your
response to two decimal places).
d) If there are no tourists at all, then the model still predicts a ridership. This is due to the fact that zero tourists are
outside the range of data used to develop the model.
e) The standard error of the estimate developed using least-squares regression = |
places).
| (round your response to three
Expert Solution
This question has been solved!
Explore an expertly crafted, step-by-step solution for a thorough understanding of key concepts.

This is a popular solution!

Trending now
This is a popular solution!

Step by step
Solved in 2 steps with 1 images

Follow-up Questions
Read through expert solutions to related follow-up questions below.
Recommended textbooks for you
Functions and Change: A Modeling Approach to Coll…
Algebra
ISBN:
9781337111348
Author:
Bruce Crauder, Benny Evans, Alan Noell
Publisher:
Cengage Learning
Functions and Change: A Modeling Approach to Coll…
Algebra
ISBN:
9781337111348
Author:
Bruce Crauder, Benny Evans, Alan Noell
Publisher:
Cengage Learning