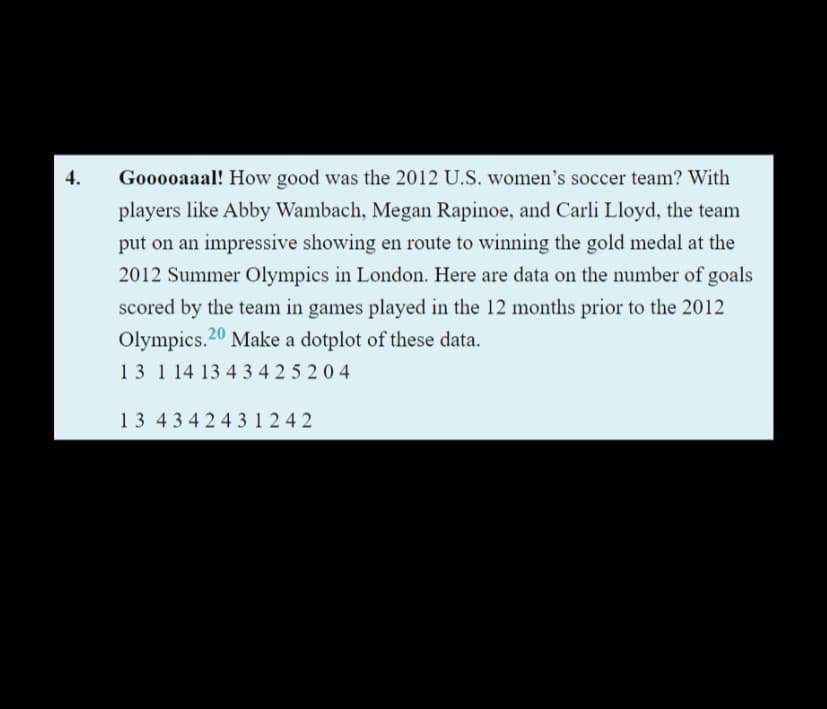
Gooooaaal! How good was the 2012 U.S. women's soccer team? With players like Abby Wambach, Megan Rapinoe, and Carli Lloyd, the team put on an impressive showing en route to winning the gold medal at the 2012 Summer Olympics in London. Here are data on the number of goals scored by the team in games played in the 12 months prior to the 2012 Olympics.20 Make a dotplot of these data. 13 1 14 13 4 3425204 13 4342431242
Q: Write aims of data classification ?
A: The Aims of data classification is as follows 1. It represents data concisely. 2. It helps to know…
Q: The data set hemorrhage.sav contains a sample of 100 low birth weight infants born in Boston,…
A: Here from the Omnibus tests of Model Coefficients, the chi-square is significant (chi-square=13.639,…
Q: 4 2 4 6 8 Which model best represents the data? 8 A 4 2 2 4 6 8
A: We are given a scatter plot and we need to find from the given options that which model best…
Q: The mode of the data 12, 10, 16, 12, 22, 19, 12, 16, 22 is 12 16 19 10 22
A: We have to find the mode of the given data . For this we can choose the number which is repeatedly…
Q: 1) Lights Out Larry is the all-time leading 3-point shooter for his high school basketball team. One…
A: Since you have asked multiple question, we will solve the first question for you. If youwant any…
Q: What is the capital cost of a plant that produces 250,000 tons per year of ethanol (fuel grade)…
A:
Q: All Fresh Seafood is a wholesale fish company based on the east coast of the U.S. Catalina Offshore…
A: Given: Sum All Fresh Seafood Prices (east) Catalina Offshore Products Prices (west) 1 19.99…
Q: 3. If a set of data has a mode, then must the mode be one of the numbers in the set? Explain.
A: Mode: Occasionally, when describing a set of data, the mode is used as a measure of central…
Q: The success of an airline depends heavily on its ability to provide a pleasant customer experience.…
A: The random variable is time follows normal distribution. There are two independent samples which are…
Q: he consideration of ethics most important
A: Ethics in research is honestly reporting data , results , methods and procedures. Being honesty and…
Q: Use a graphing utility to find the line of best fit for thefollowing data
A: Select the LIST option from the calculator. Select L1 from Edit option and insert all the x-y values…
Q: a) Develop a scatter diagram for these data. Does a linear relationship appear reasonable? Explain.…
A: Note: Since you have posted a question with multiple sub-parts, we will solve the first three…
Q: 4. A Zumba instructor remembers the data given in the following table, which shows the recommended…
A: Note: Since you have posted questions with multiple subparts we will solve the first three questions…
Q: A Zumba instructor remembers the data given in the following table, which shows the recommended…
A: Note: Since you have posted a question with multiple subparts, we will solve the first three…
Q: Identical twins come from a single egg that split into two embryos, and fratemal twins are from…
A: The tabular form of records of twins, boy/boy boy/girl girl/boy girl/girl Identical twins 9…
Q: 20 17 17 40 se are paired data. 3. 2.
A: Hi! Thank you for the question, As per the honor code, we are allowed to answer three sub-parts at…
Q: 6.2 Identify relationships, Part II. For each of the six plots, identify the strength of the…
A: Note: Hey there! Thank you for the question. As you have posted a question with multiple sub-parts,…
Q: I have attached the data set. My only problem is finding the standard deviation for the set as it…
A: The mean and standard deviation are calculated using Excel. Steps are as follows: Enter the data…
Q: 15. fast please. Exercises 15 -18 refer to the following The calorie intake content and sodium…
A: Use the Excel and Perform the Regression. Followings are the Steps to perform the Regression 1) Open…
Q: 4) An electric car is a great way to save a lot of money on gas. The chart below contains data about…
A: The given data represents the number of electronic cars sold after 2010, let x=0 for 2010 and…
Q: Just need help with number 31
A: 31. Given :
Q: Indicate why the give method for running a simulation is not accurate. A bag contains 4 red marbles,…
A: Here, the marbles are drawn one-by-one and are not replaced.
Q: The data set hemorrhage.sav contains a sample of 100 low birth weight infants born in Boston,…
A: 1. The task is to test the association between the variables. Ho : β0=β1=β2=β3H1 : At least two of…
Q: Using a 0.05 level of significance, what is your conclusion? Reject H0. There is statistical…
A:
Q: 4. A Zumba instructor remembers the data given in the following table, which shows the recommended…
A: Since you have posted a question with multiple sub-parts, we will solve first three sub- parts for…
Q: 4. A Zumba instructor remembers the data given in the following table, which shows the recommended…
A: given data age x years 20 40 60 maximum heart rate y beats per minute 170 153 136 a) find…
Q: All Fresh Seafood is a wholesale fish company based on the east coast of the U.S. Catalina Offshore…
A: Solution: The hypothesis can be classified into two types 1)Null hypothesis 2) Alternative…
Q: 5) The marketing director of Sea World was concerned about the effectiveness of a recent advertising…
A: Boxplot---
Q: A Bachelors in Finance (Hons) student wishes to see if there is a relationship between the amount of…
A: We have given that, X :- 1924, 907, 1445, 1608, 661 Y:- 1685, 1838, 1734, 1842, 1317 Then, We will…
Q: a. What values of P1, P2, and P3 seem reasonable? For example, would you expect P1 < P2 < P3 or the…
A: Confidence interval
Q: 4.1 Predicting Land Value Both figures concern the assessed value of land (with homes on the land),…
A: 4.1 The scatterplot (A) is the plot between variables 'acres of land' and 'value of land'. The…
Q: 2. Refer to the chart below for the following questions. Unemployment rate 8% 7% 6% 5% 4% 3% 2% 1%…
A: Since you have posted a question with multiple subparts, we will solve first three subparts for you.…
Q: Floor Plan A Floor Plan B Floor Plan C…
A: df = 3-1 = 2
Q: he data set hemorrhage.sav contains a sample of 100 low birth weight infants born in Boston,…
A: The variables will be able to predict haemorrhage if each variable is dependent on the response…
Q: (e) Use the boxplot for the current golf balls to say whether the data are symmetrical or skewed. If…
A: Symmetric Data is said to be symmetric when the values of variables appear at regular frequencies…
Q: Q2: Discuss the three types of data in an enterprise system and how they are.
A: 1. Briefly explain the three types of data in an enterprise system and how they are related. All…
Q: A cosmetic company gives sales training to its newly hired employees. To determine how effective the…
A: Given:
Q: As you read about each study, (a) classify the type of research that it reflects, and (b)…
A: Part a: It has been given that, During their 8th- and 11th-grade school years, students in the…
Q: The Chicago Cubs win an average of 56.8% of all their games. How should this data be classified?…
A: Nominal data: Nominal data measure qualitative data and it is the name of variable. example: Smoking…
Q: The British Department of Transportation studied to see if people avoid driving on Friday the 13th.…
A:
Q: Pursuing an MBA is a major personal investment. Tuition and expenses associated with business school…
A: The independent variable is Program Per-Year Tuition. The dependent variable s Mean Starting Salary…
Q: 10.37 Chapter 10: Section Exercises Gender and Happiness of Marriage The table shows the results of…
A: Given table shows the results of a two-way table of gender and whether a person is happy in his or…
Q: Pursuing an MBA is a major personal investment. Tuition and expenses associated with business school…
A: Given information: Program Per-Year Tuition ($) Mean Starting Salary upon Graduation($) 64011…
Q: 3. Which of the following scatterplots is the best representation of two variables having a strong,…
A:
Q: All Fresh Seafood is a wholesale fish company based on the east coast of the U.S. Catalina Offshore…
A: The data shows the all fresh seafood prices and Catalina offshore products prices.
Q: Construction Receptionist 20 25 30 35 40 45 50 55 60 Salary (thousands of S) Jennie makes the median…
A: Given: The boxplot of the salaries of the construction workers and the receptionists.
Q: The table shows the worldwide box office (in billions of dollars) for the movie industry during the…
A: topic - sets
Q: i 3 4 7 8. 9. 10 1 14 10 7 8. 1 12 2 Xi Yi 95 80 83 87 88 85 99 102 79 95 Molro o goottornlot of the…
A: As we are authorized to answer only 3 subparts for each question and that you haven't specified…
Q: All Fresh Seafood is a wholesale fish company based on the east coast of the U.S. Catalina Offshore…
A:
Q: 国 14 On a cold day in Minneapolis, the afternoon temperature was 48 degrees before a cold front…
A: Question is solved.
Trending now
This is a popular solution!
Step by step
Solved in 2 steps with 1 images
- Refer to exhibit 1 below. What is the prediction equation for determining Heat BTU’s? a. Heat BTU’s = 389 + 2.12 Burn Rate + 5.32 Fuel density + 24.1 Mixing Time b. Heat BTU’s = 66 + 1.21 Burn Rate + 0.96 Fuel density - 1.87 Mixing Time c. Heat BTU’s = 5.89 + 1.75 Burn Rate + 5.52 Fuel density - 12.92 Mixing Time d. Heat BTU’s = 389 + 2.12 Burn Rate + 5.32 Fuel density - 24.1 Mixing Time Impossible to determine from this research4) Here are data on the lengths of male and female roaches (in mm). Your job is to find out if there is adifference between male and female roaches (this should be two sided - why?).males 15.4 13.9 12.7 9.6 6.6 10.7 9.9 13.3 16.2 9.0 11.4 16.6 12.2females 16.7 16.3 12.8 16.9 15.1 12.8 18.7 18.3 8.6 13.6 15.3 16.2 13.4It's up to you to figure out what the best procedure is, what kind of hypotheses to use, which α to use,what test to use, and so on. Make sure you follow all the appropriate steps. You should probably use Ras you’ll get done much quicker. Remember to very clearly state your results in writing. Never turn in just an R printout .Hint: how do you decide which test to use? What kind of distributions do the data have?3.4 The system is tested on a sample of one hundred computers and the average connection speed is found to be far below 400 kilobits. What hypothesis should probably be rejected? Explain. If the customer needs a connection speed of 400 kilobits to run her application programs, what is the business decision that corresponds to the decision regarding the hypotheses?
- Windy, part III Exercises 12 and 14 give summaries anddisplays for two potential sites for a wind turbine. Testan appropriate hypothesis to see if there is evidence thateither of these sites has a higher average wind speed.If a hypothesis makes predictions that are not accurate and do not help explain future observations, do those inaccurate predictions prove the hypothesis is not a good model of reality? On the other hand, if thehypothesis does make accurate predictions, does that accuracy prove the hypothesis is correct?A sociologist recorded the number of contacts entered in a cell phone and the number of texts sent in a week for 20 cell phone users. The resulting data were used to conduct a hypothesis test to investigate whether there is a linear relationship between the number of contacts and the number of texts sent. What are the correct hypotheses for the test? H0:β1=0Ha:β1≠0H0:β1=0Ha:β1≠0 A H0:β1=0Ha:β1>0H0:β1=0Ha:β1>0 B H0:β1=0Ha:β1<0H0:β1=0Ha:β1<0 C H0:β1≠0Ha:β1=0H0:β1≠0Ha:β1=0 D H0:b1=0Ha:b1≠0 E
- The 2019-2020 flu season was especially tough. By the end of the season, an estimated total of 49 million people in the United States had contracted the flu, of whom an estimated 79,000 died from the flu. Assume that the US population was 300,000,000 during the 2019-2020 flu season and that during the season, a total of 2.9 million Americans died from all causes (including the flu). Assume the population of the US remained the same at the midpoint of the season. Report mortality rates per 100,000. Be sure to express the measure in the correct format. a.What was the proportionate mortality rate from flu during the 2019-2020 flu season? b.What was the case fatality rate from flue during the 2019-2020 flu season?The 2019-2020 flu season was especially tough.By the end of the season, an estimated total of 49 million people in the United States had contracted the flu, of whom an estimated 79,000 died from the flu. Assume that the US population was 300,000,000 during the 2019-2020 flu season and that during the season, a total of 2.9 million Americans died from all causes (including the flu). Assume the population of the US remained the same at the midpoint of the season. Report mortality rates per 100,000. Be sure to express the measure in the correct format. c.What was the flu-related mortality rate during the 2019-2020 flu season? d.What is the all-cause mortality rate during the 2019-2020 flu season? e.In a country with an age distribution that is much younger than in the US, the proportionate mortality rate from flu in 2019 was 5%. Based on this information alone, can we determine that the risk of dying from flu in 2019 was higher in this country compared to the US? Why or why not?URGENT PLEASE ANSWER ASAP What is the null hypothesis given the way the solid green line is drawn on the graph?
- 4) the accompanying dataset provides data on monthly unemployment rates for a certain region over four years. Compare 3- and 12- month moving average forecast using the MAD criterion. Which of the two models yields better results? (See picture) Find the MAD for the 3 month moving average forcast. MAD = _____b) What are the three models proposed as extensions of the GARCH model? Describe their advantages over the GARCH.A municipal solid-waste site for a city must be located at Site A or Site B. After sorting, some of the solid refuse will be transported to an electric powerplant where it will be used as fuel. Data for the hauling of refuse from each site to the power plant are shown in Table P2-4. If the power plant will pay $8.00 per cubic yard of sorted solid waste delivered to the plant, where should the solid-waste site be located? Use the city’s viewpoint and assume that 200,000 cubic yards of refuse will be hauled to the plant for one year only. One site must be selected.