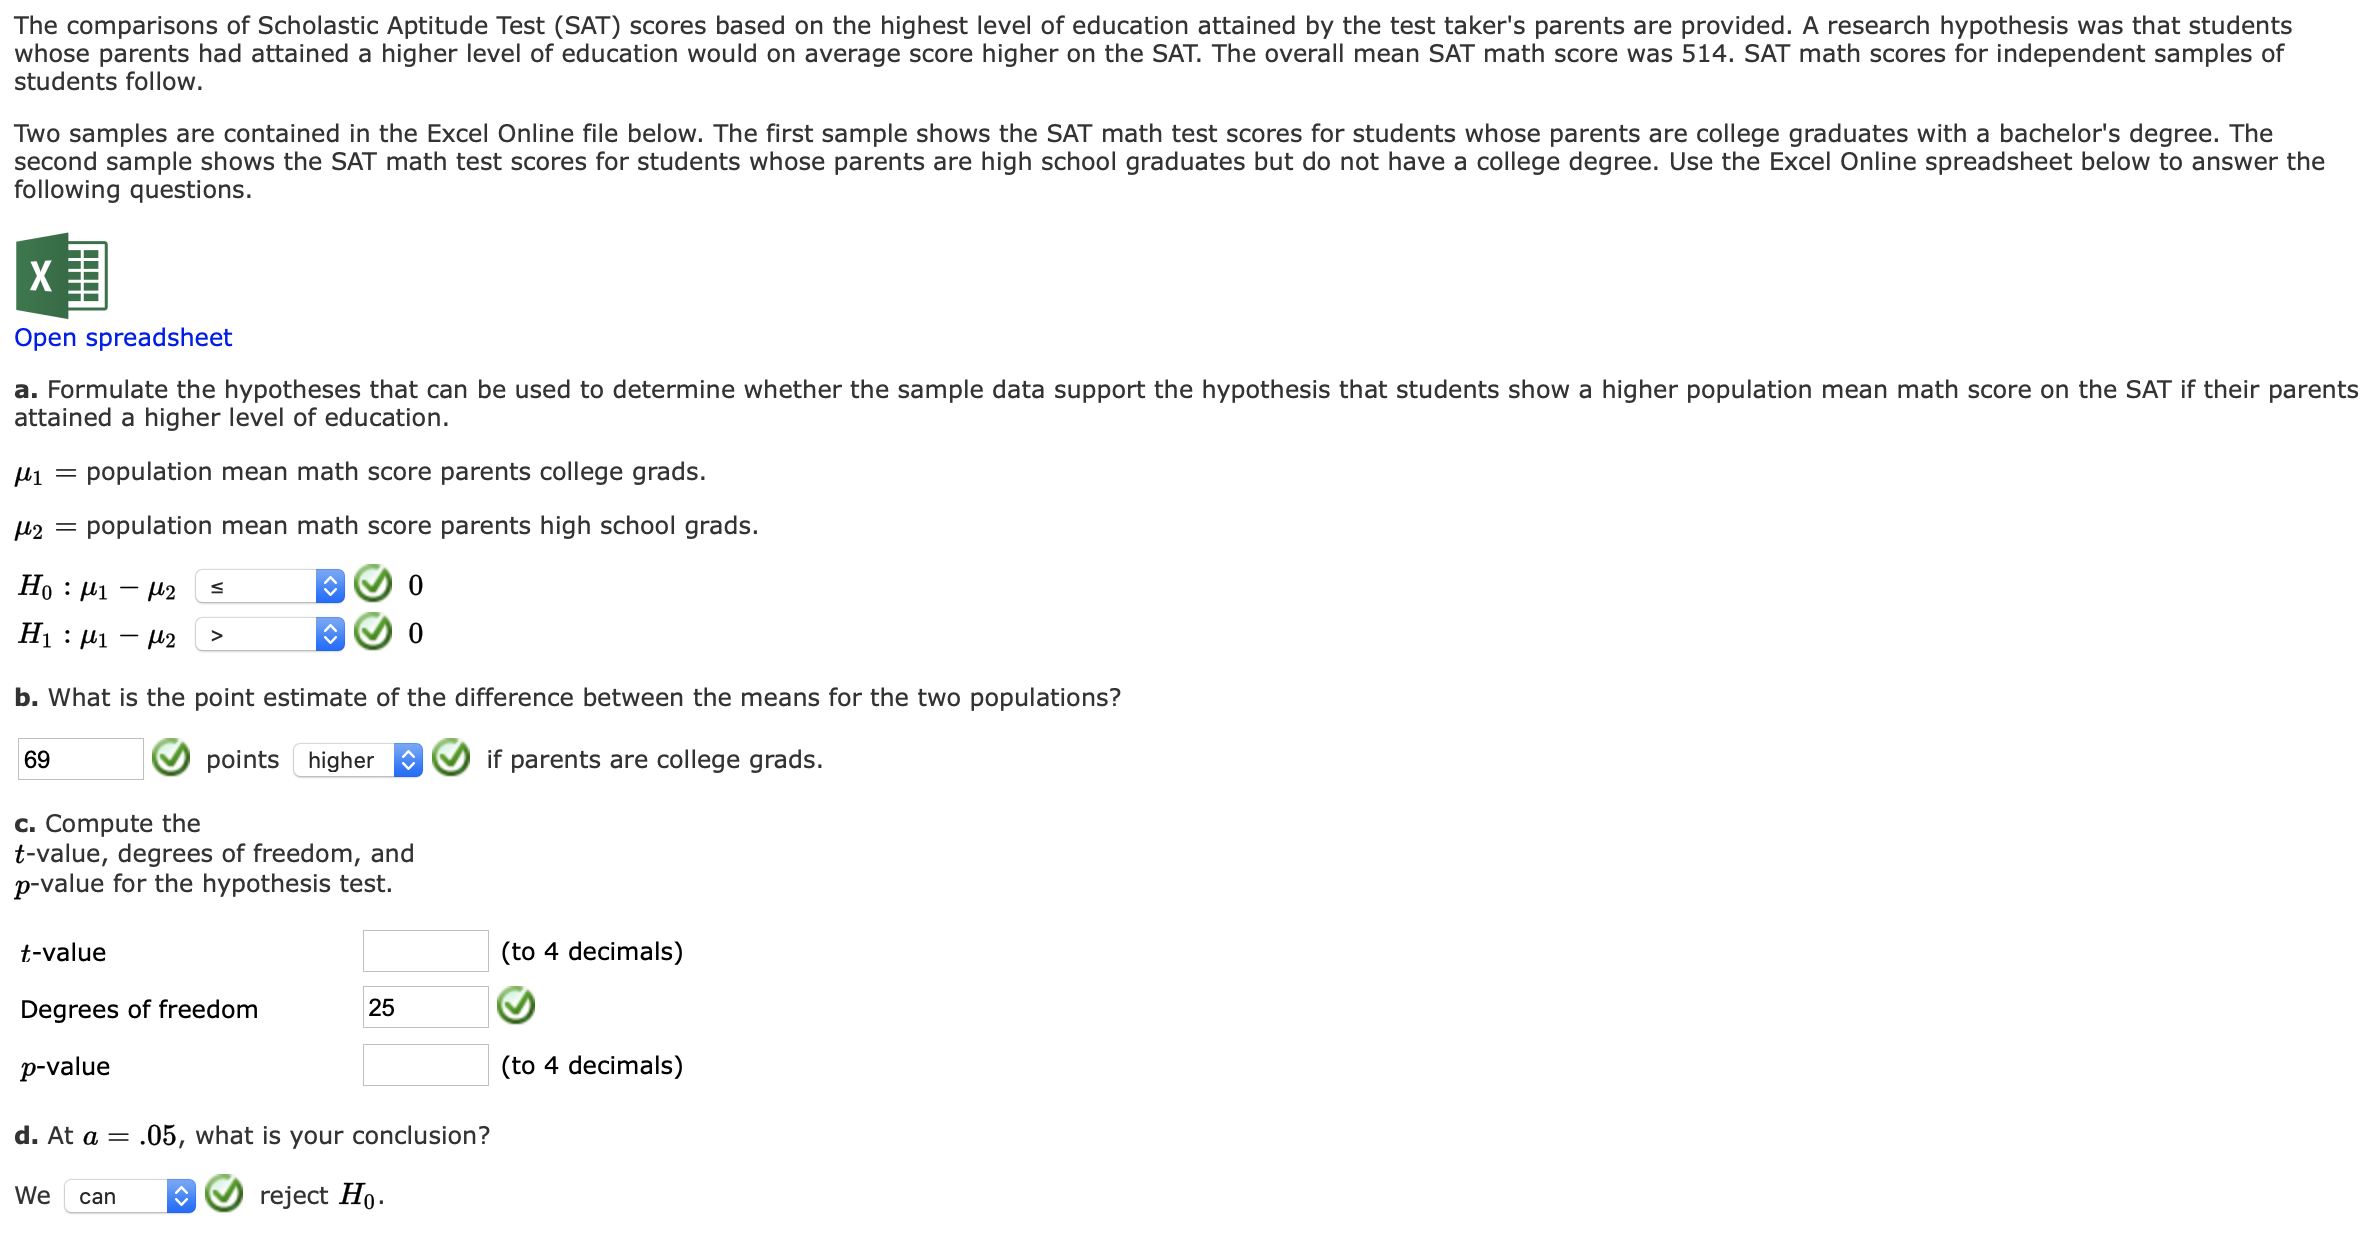
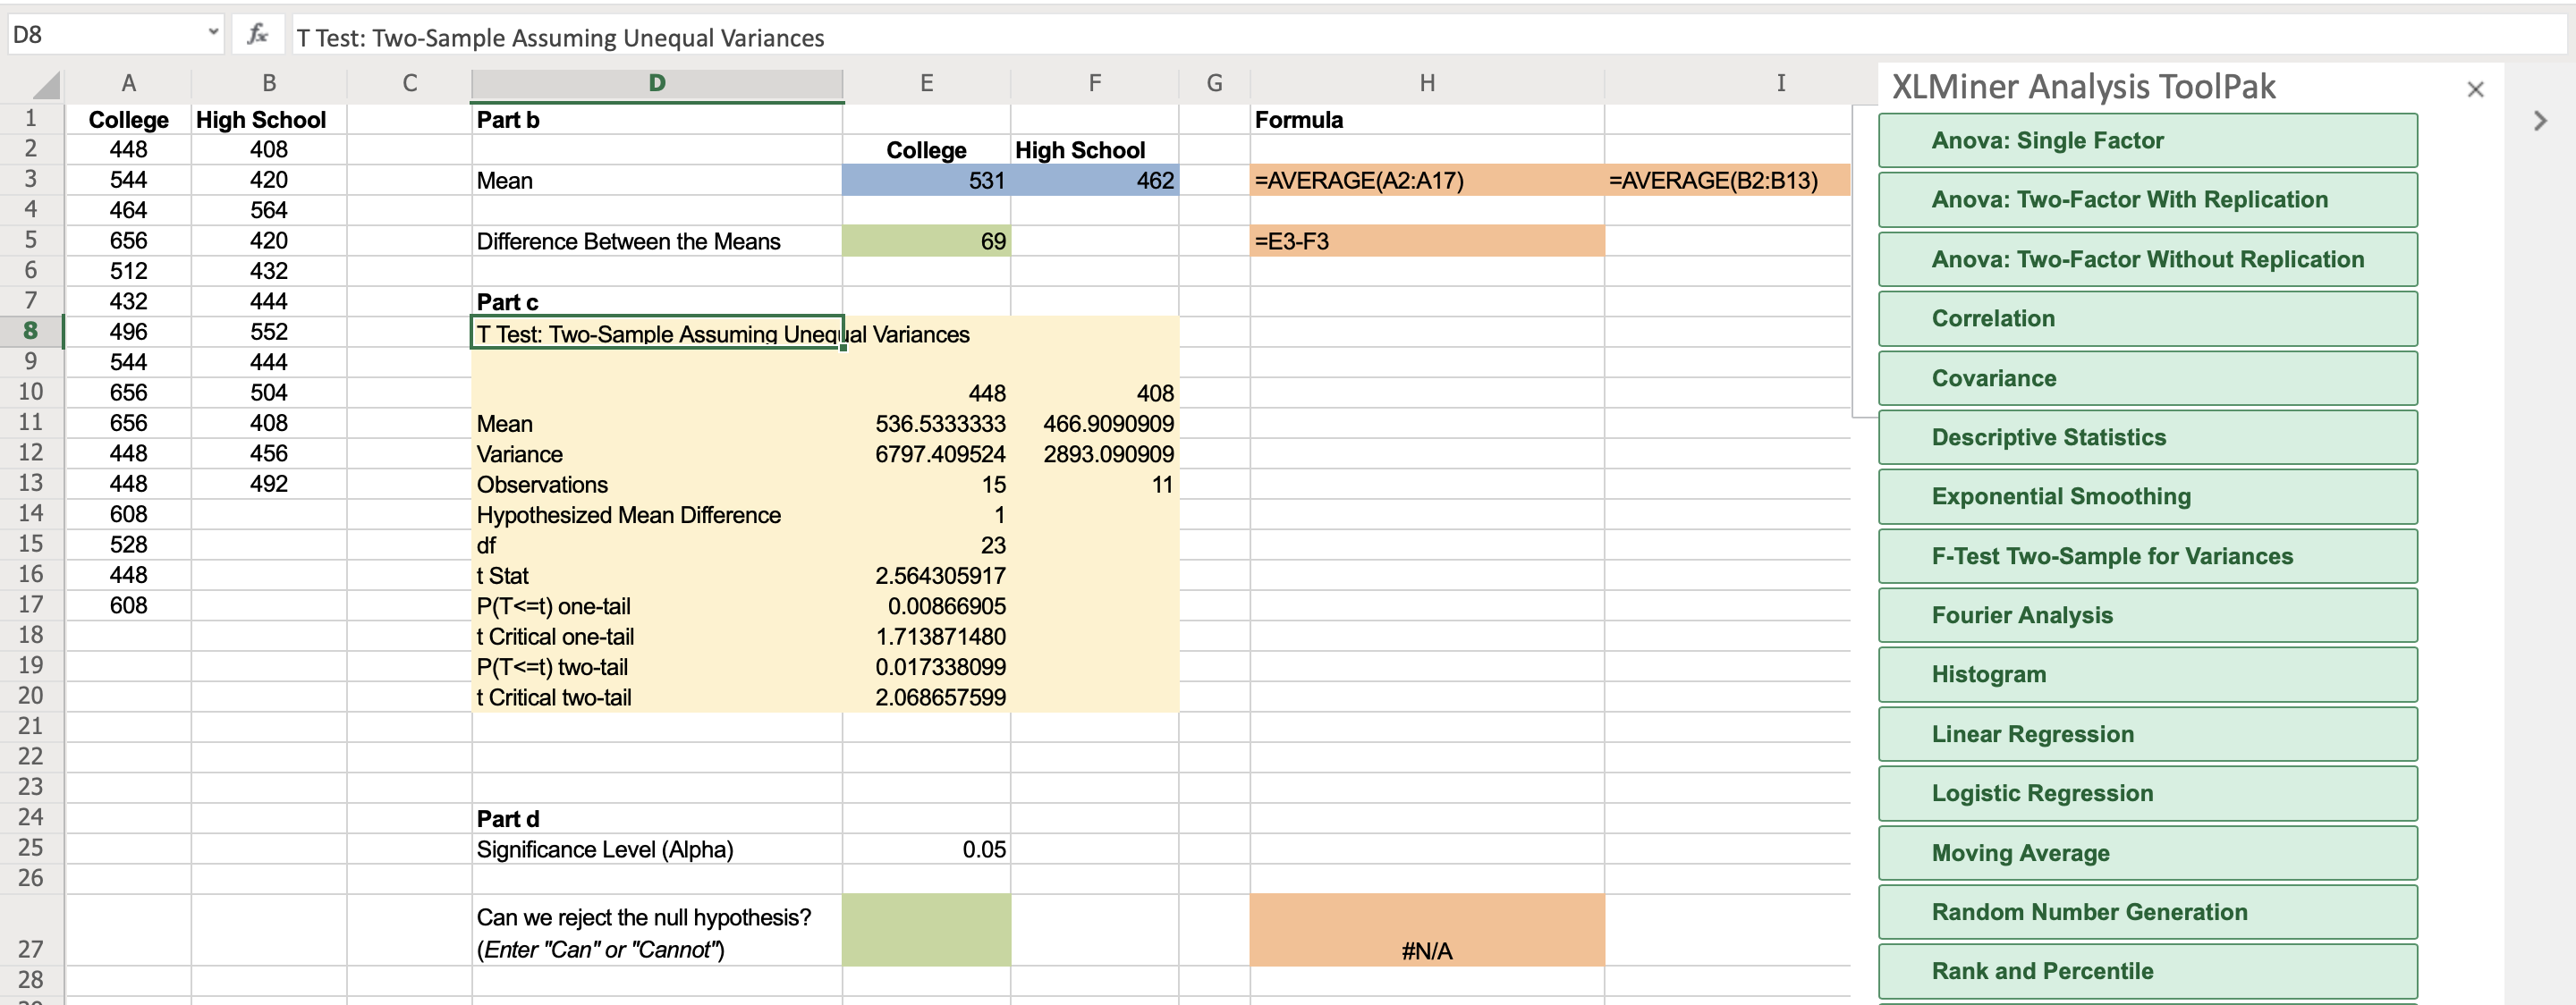
The comparisons of Scholastic Aptitude Test (SAT) scores based on the highest level of education attained by the test taker's parents are provided. A research hypothesis was that students whose parents had attained a higher level of education would on average score higher on the SAT. The overall mean SAT math score was 514. SAT math scores for independent samples of students follow. Two samples are contained in the Excel Online file below. The first sample shows the SAT math test scores for students whose parents are college graduates with a bachelor's degree. The second sample shows the SAT math test scores for students whose parents are high school graduates but do not have a college degree. Use the Excel Online spreadsheet below to answer the following questions. Open spreadsheet a. Formulate the hypotheses that can be used to determine whether the sample data support the hypothesis that students show a higher population mean math score on the SAT if their parents attained a higher level of education. µ1 = population mean math score parents college grads. u2 = population mean math score parents high school grads. Но : иi — р2 H1 : 41 - l2 b. What is the point estimate of the difference between the means for the two populations? 69 points higher if parents are college grads. c. Compute the t-value, degrees of freedom, and p-value for the hypothesis test. t-value (to 4 decimals) Degrees of freedom 25 p-value (to 4 decimals) d. At a = .05, what is your conclusion? We reject Ho. can D8 fe T Test: Two-Sample Assuming Unequal Variances XLMiner Analysis ToolPak A Н College High School Part b Formula High School Anova: Single Factor 448 408 College 544 420 Mean 531 462 =AVERAGE(A2:A17) =AVERAGE(B2:B13) Anova: Two-Factor With Replication 464 564 656 420 Difference Between the Means 69 3ЕЗ-F3 Anova: Two-Factor Without Replication 512 432 Part c T Test: Two-Sample Assuming Unequal Variances 432 444 Correlation 8. 496 552 9. 544 444 Covariance 10 656 504 448 408 11 656 408 Mean 536.5333333 466.9090909 Descriptive Statistics 12 448 456 Variance 6797.409524 2893.090909 13 448 492 Observations 15 11 Exponential Smoothing 14 608 Hypothesized Mean Difference 15 528 df t Stat P(T<=t) one-tail t Critical one-tail P(T<=t) two-tail t Critical two-tail 23 F-Test Two-Sample for Variances 16 448 2.564305917 17 608 0.00866905 Fourier Analysis 18 1.713871480 19 0.017338099 Histogram 20 2.068657599 21 Linear Regression 22 23 Logistic Regression 24 Part d 25 Significance Level (Alpha) 0.05 Moving Average 26 Can we reject the null hypothesis? |(Enter "Can" or "Cannot") Random Number Generation 27 #N/A Rank and Percentile 28


Percentage
A percentage is a number indicated as a fraction of 100. It is a dimensionless number often expressed using the symbol %.
Algebraic Expressions
In mathematics, an algebraic expression consists of constant(s), variable(s), and mathematical operators. It is made up of terms.
Numbers
Numbers are some measures used for counting. They can be compared one with another to know its position in the number line and determine which one is greater or lesser than the other.
Subtraction
Before we begin to understand the subtraction of algebraic expressions, we need to list out a few things that form the basis of algebra.
Addition
Before we begin to understand the addition of algebraic expressions, we need to list out a few things that form the basis of algebra.
Find the t-value and p-value


Trending now
This is a popular solution!

Step by step
Solved in 2 steps with 2 images


