The commercial division of a real estate firm is conducting a regression analysis of the relationship between x, annual gross rents (in thousands of dollars), and y, selling price (in thousands dollars) for apartment buildings. Data were collected on several properties recently sold and the following computer output was obtained. ANOVA df MS F Significance F Regression 1 41587.6 Residual 7 Total 8 51984.9 Coefficients Standard Error t Stat P-value Intercept 20.000 3.2213 6.21 Annual Gross 7.290 1.3625 5.29 Rents a. How many apartment buildings were in the sample? b. Write the estimated regression equation (to 2 decimals if necessary). 20 7.21 a c. Use the t statistic to test the significance of the relationship at a 0.05 level of significance. What is the p-value? Use Table 2 of Appendix B. p-value is greater than 0.10 What is your conclusion? Conclude that the selling price is related to annual gross rents. d. Use the F statistic to test the significance of the relationship at a 0.05 level of significance. Compute the F test statistic (to 2 decimals).
The commercial division of a real estate firm is conducting a regression analysis of the relationship between x, annual gross rents (in thousands of dollars), and y, selling price (in thousands dollars) for apartment buildings. Data were collected on several properties recently sold and the following computer output was obtained. ANOVA df MS F Significance F Regression 1 41587.6 Residual 7 Total 8 51984.9 Coefficients Standard Error t Stat P-value Intercept 20.000 3.2213 6.21 Annual Gross 7.290 1.3625 5.29 Rents a. How many apartment buildings were in the sample? b. Write the estimated regression equation (to 2 decimals if necessary). 20 7.21 a c. Use the t statistic to test the significance of the relationship at a 0.05 level of significance. What is the p-value? Use Table 2 of Appendix B. p-value is greater than 0.10 What is your conclusion? Conclude that the selling price is related to annual gross rents. d. Use the F statistic to test the significance of the relationship at a 0.05 level of significance. Compute the F test statistic (to 2 decimals).

MATLAB: An Introduction with Applications
6th Edition
ISBN:9781119256830
Author:Amos Gilat
Publisher:Amos Gilat
Chapter1: Starting With Matlab
Section: Chapter Questions
Problem 1P

Related questions
Question
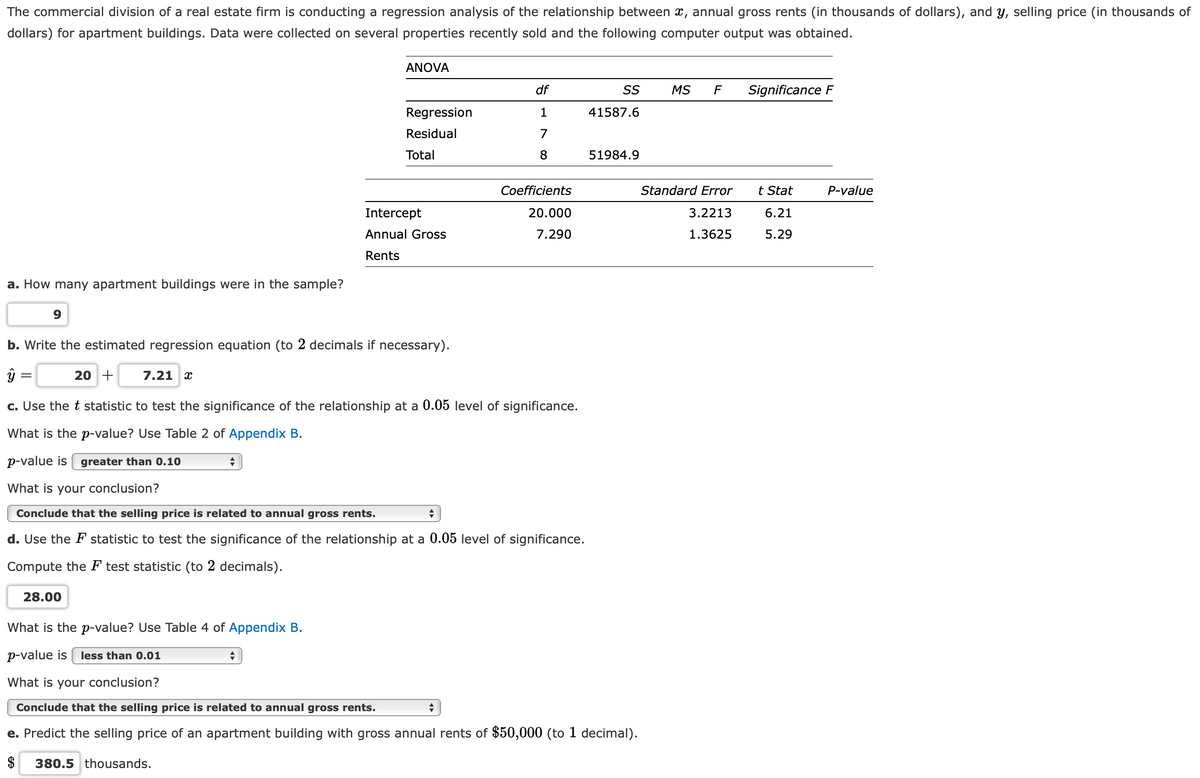
Transcribed Image Text:The commercial division of a real estate firm is conducting a regression analysis of the relationship between x, annual gross rents (in thousands of dollars), and y, selling price (in thousands of
dollars) for apartment buildings. Data were collected on several properties recently sold and the following computer output was obtained.
ANOVA
df
SS
MS
F
Significance F
Regression
1
41587.6
Residual
7
Total
8
51984.9
Coefficients
Standard Error
t Stat
P-value
Intercept
20.000
3.2213
6.21
Annual Gross
7.290
1.3625
5.29
Rents
a. How many apartment buildings were in the sample?
9
b. Write the estimated regression equation (to 2 decimals if necessary).
20 +
7.21 x
c. Use the t statistic to test the significance of the relationship at a 0.05 level of significance.
What is the p-value? Use Table 2 of Appendix B.
p-value is greater than 0.10
What is your conclusion?
Conclude that the selling price is related to annual gross rents.
d. Use the F statistic to test the significance of the relationship at a 0.05 level of significance.
Compute the F test statistic (to 2 decimals).
28.00
What is the p-value? Use Table 4 of Appendix B.
p-value is
less than 0.01
What is your conclusion?
Conclude that the selling price is related to annual gross rents.
e. Predict the selling price of an apartment building with gross annual rents of $50,000 (to 1 decimal).
$
380.5 thousands.
Expert Solution
This question has been solved!
Explore an expertly crafted, step-by-step solution for a thorough understanding of key concepts.

Step by step
Solved in 2 steps with 2 images

Recommended textbooks for you
MATLAB: An Introduction with Applications
Statistics
ISBN:
9781119256830
Author:
Amos Gilat
Publisher:
John Wiley & Sons Inc

Probability and Statistics for Engineering and th…
Statistics
ISBN:
9781305251809
Author:
Jay L. Devore
Publisher:
Cengage Learning

Statistics for The Behavioral Sciences (MindTap C…
Statistics
ISBN:
9781305504912
Author:
Frederick J Gravetter, Larry B. Wallnau
Publisher:
Cengage Learning
MATLAB: An Introduction with Applications
Statistics
ISBN:
9781119256830
Author:
Amos Gilat
Publisher:
John Wiley & Sons Inc
Probability and Statistics for Engineering and th…
Statistics
ISBN:
9781305251809
Author:
Jay L. Devore
Publisher:
Cengage Learning
Statistics for The Behavioral Sciences (MindTap C…
Statistics
ISBN:
9781305504912
Author:
Frederick J Gravetter, Larry B. Wallnau
Publisher:
Cengage Learning

Elementary Statistics: Picturing the World (7th E…
Statistics
ISBN:
9780134683416
Author:
Ron Larson, Betsy Farber
Publisher:
PEARSON

The Basic Practice of Statistics
Statistics
ISBN:
9781319042578
Author:
David S. Moore, William I. Notz, Michael A. Fligner
Publisher:
W. H. Freeman

Introduction to the Practice of Statistics
Statistics
ISBN:
9781319013387
Author:
David S. Moore, George P. McCabe, Bruce A. Craig
Publisher:
W. H. Freeman