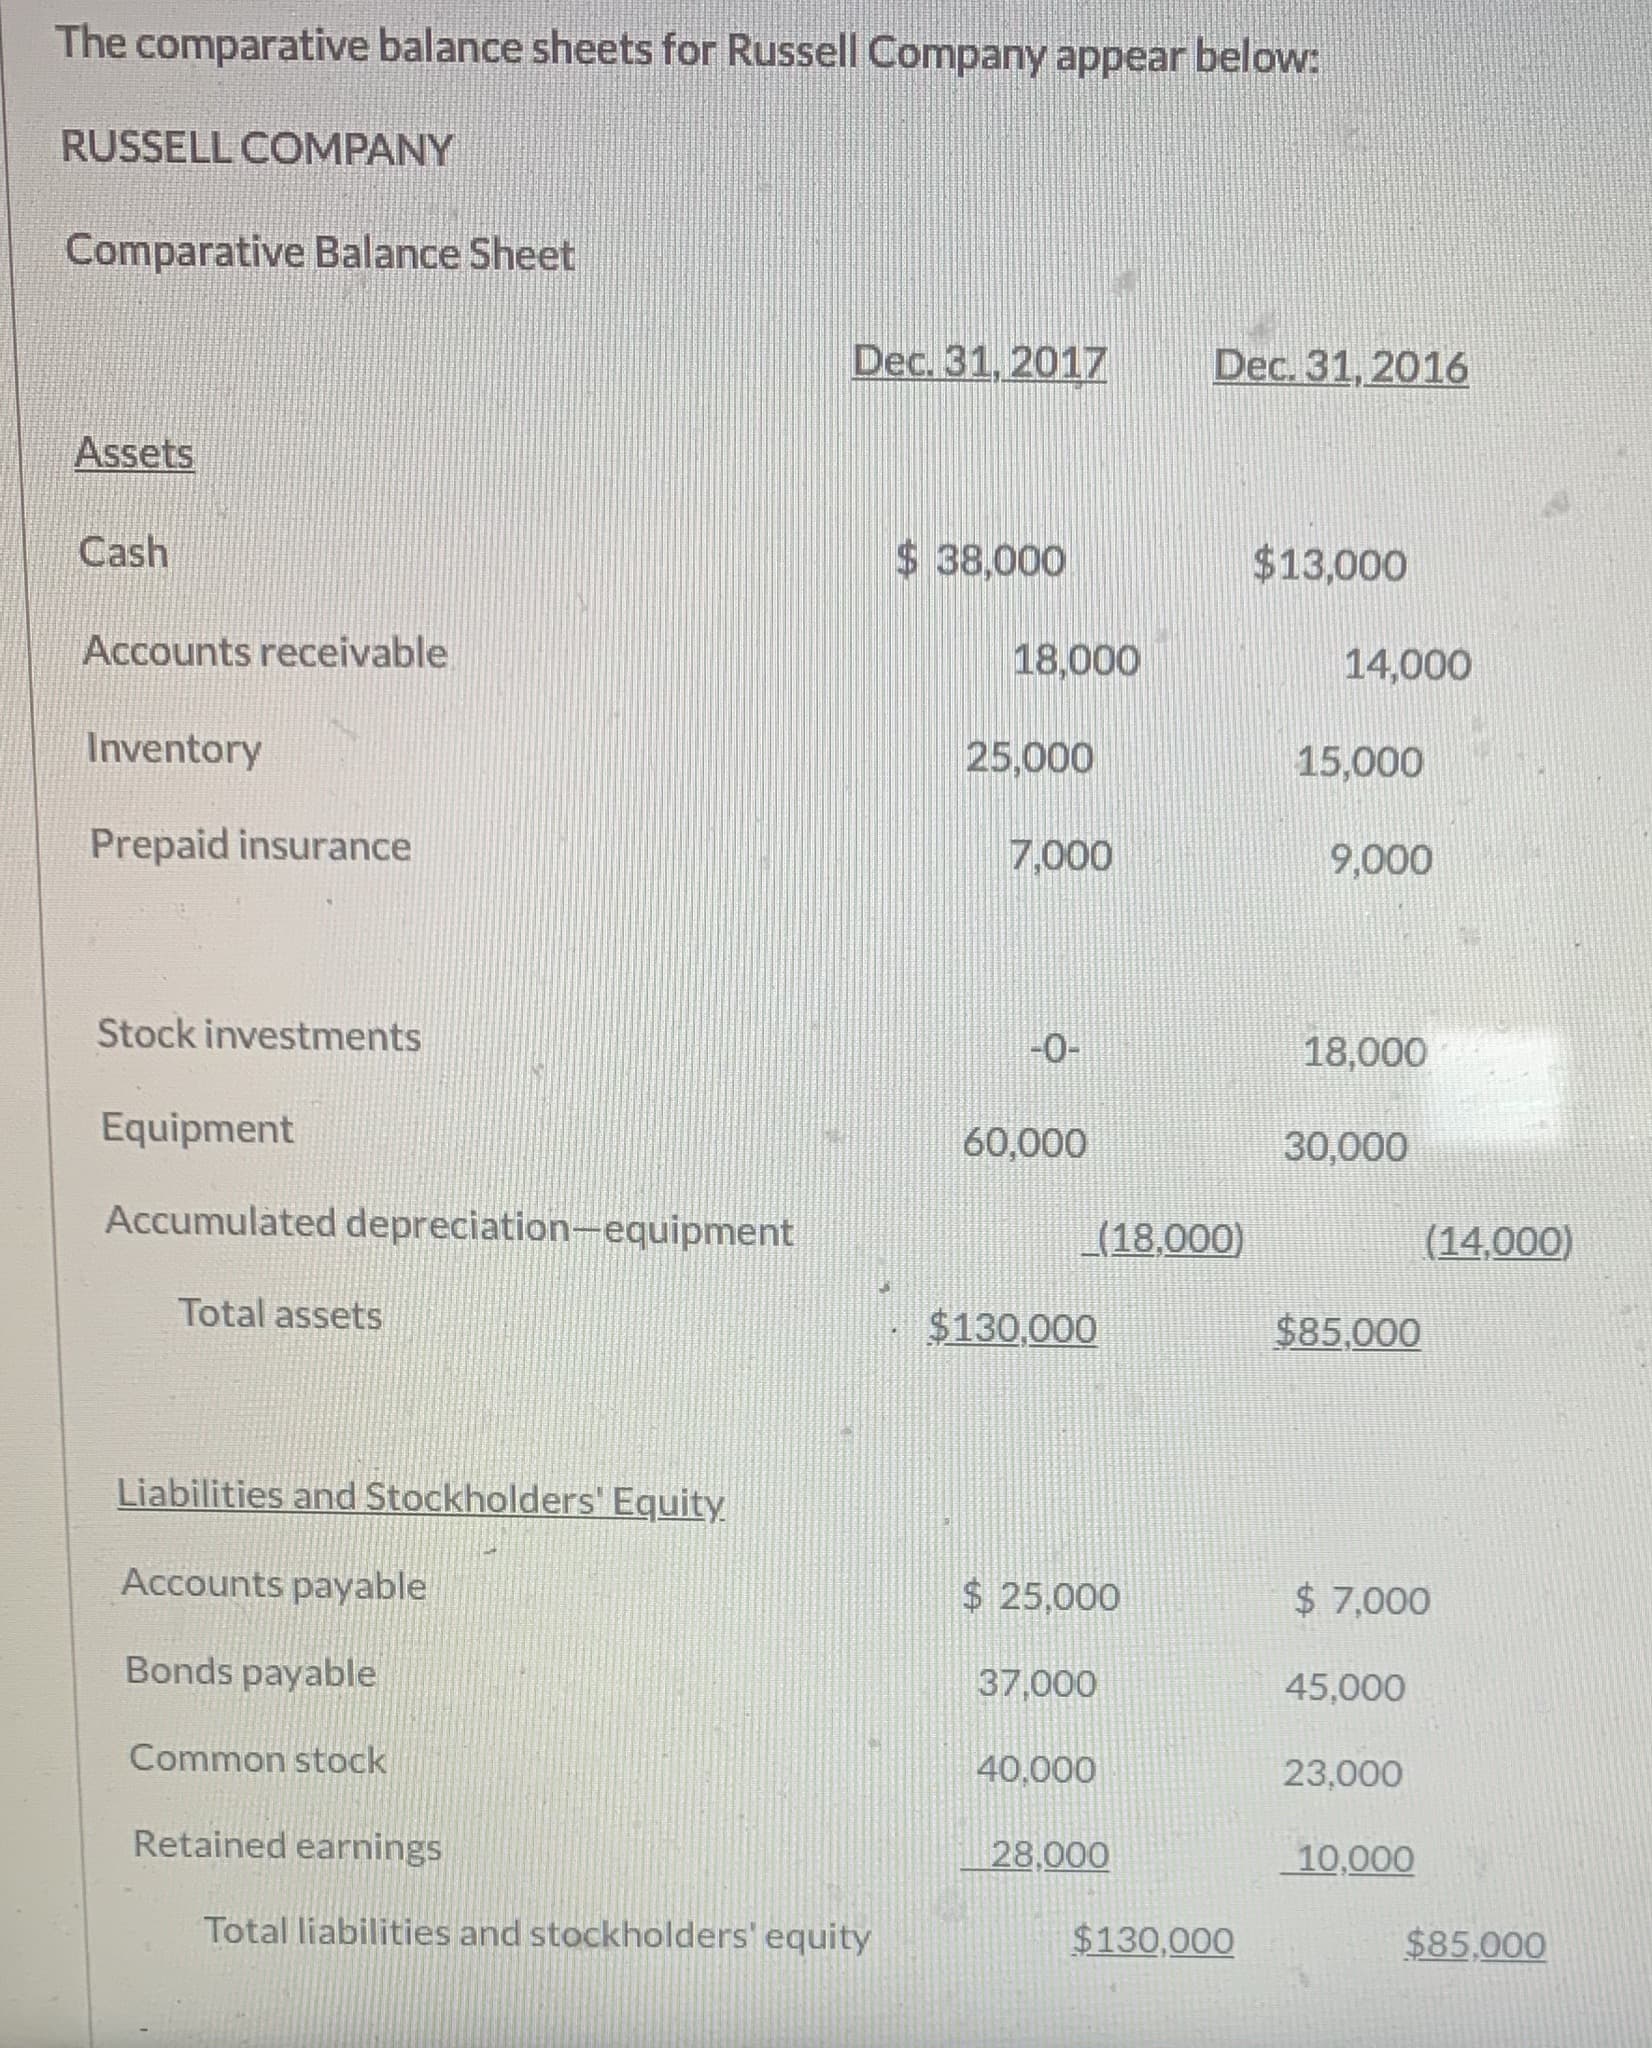
The comparative balance sheets for Russell Company appear below: RUSSELL COMPANY Comparative Balance Sheet Dec. 31, 2017 Dec. 31, 2016 Assets Cash $ 38,000 $13,000 Accounts receivable 18,000 14,000 Inventory 25,000 15,000


Q: Mulder Corporation's comparative balance sheets are presented below: MULDER CORPORATION Balance…
A: Inc frm wrkng exercises Net income ..........$ 22,600 Change for: Devaluation and amortization…
Q: The comparative balance sheet of Whitman Co. at December 31, 2016 and 2015, is as follows: Dec.…
A: Statement of cash flows indicates cash inflow or outflows for the different three activities.…
Q: 1. The following information is provided in the 2018 annual report to shareholders of The BizStore:…
A: The balance sheet represents the financial position of the company that includes assets,…
Q: Wiemers Corporation’s comparative balance sheets are presented below. WIEMERS CORPORATION Balance…
A: Current Ratio - Current ratio is the ratio of Current Assets and Current Liabilities. It measures…
Q: Global Filter Corp.'s balance sheet and income statement are as follows: Global Filter Corp. Global…
A:
Q: Here are comparative statement data for Crane Company and Sheridan Company, two competitors. All…
A: Comparative balance sheet used to compare the financial statement of two or more periods. It is…
Q: Sage Hill Inc. had the following balance sheet at December 31, 2016. SAGE HILL INC. BALANCE…
A: 1. Plant Assets PARTICULAR DEBIT PARTICULAR CREDIT To balance B/d 35,500 By…
Q: Diamond Corp. has provided the following information for the year ended December 31, 2018.…
A: Cash flow statement is a statement which is prepared to find out the cash comes in and goes out , by…
Q: What is the firm’s 2018 current ratio? Round your answer to two decimal places. The 2018 current…
A: Rosnan Industries 2018 Ratio Analysis A - Current Asset Ratio is 1.95 times (770/395) B - Total…
Q: Required information [The following information applies to the questions displayed below.] Simon…
A: Compute the profit margin ratio for 2016:
Q: In alphabetical order below are balance sheet items for Vaughn Manufacturing at December 31, 2017.…
A: Balance sheet: This financial statement reports a company’s resources (assets) and claims of…
Q: The comparative balance sheet for Proctor Precision appears below: PROCTOR PRECISION Comparative…
A: Cash inflow means the money is going in the business . The cash can go by in any means be…
Q: Required information [The following information applies to the questions displayed below.] Simon…
A: As per the requirement, we need to calculate return on total assets. The return on total assets can…
Q: The current sections of Bridgeport Corp.'s balance sheets at December 31, 2016 and 2017, are…
A: Statement of cash flows: It is one of the financial statement that shows the cash and cash…
Q: JUST DEW IT CORPORATION 2017 and 2018 Balance SheetsAssetsLiabilities and Owners' Equity 20172018…
A: Current ratio:: It is the ratio of total current assets to total current liabilities. Current ratio…
Q: Preparing the direct method statement of cash flows Red Toy Company reported the following…
A: 1. Collections from customers during 2018 = Beginning accounts receivables + Net sales revenue -…
Q: Below is selected balance sheet and income statement information from Brahtz & Company. 2014 2013 $…
A: Ratios help in analyzing the actual position of the company whether the company is able to meet the…
Q: a) From the information above, prepare a statement of cash flows (indirect method) for Hartman,…
A: The Company has prepared the following comparative balance sheets for 2017 and 2018. Required (a)…
Q: Required information [The following information applies to the questions displayed below.] Simon…
A: Calculate the average total assets for 2016:
Q: Required information [The following information applies to the questions displayed below.] Simon…
A: Compute the accounts receivable turnover ratio for 2016:
Q: Required information [The following information applies to the questions displayed below.] Simon…
A: Calculate the average inventory for 2016:
Q: JKL Company COMPARATIVE BALANCE SHEET For the Year 2015 & 2016 2015 290,000 Assets 2016 400,000 Cash…
A: Gross Margin Ratio = Gross Margin / Net Sales Profit Margin Ratio = Net income / Net sales
Q: Simon Company's year-end balance sheets follow. At December 31 2017 2016 2015 Assets $ 25,796 $…
A: Days Sales Uncollected: The days' sales uncollected ratio is a liquidity measure that creditors and…
Q: Vaughn Manufacturing reported the following selected information at March 31. 2017 Total current…
A: Current ratio is computed by dividing current assets by current liabilities Total current…
Q: Could you please explain me how to solve the ploblem attach
A: Definition of Cash Flow Statement:Cash Flow statement is a financial statement that provide all the…
Q: Comparative financial statement data for Flounder Corp. and Blue Spruce Corp., two competitors,…
A: Ratio Analysis: Ratio analysis is a process of determining the relationship between accounting…
Q: Presented below are the fi nancial statements of Rajesh Company. RAJESH COMPANY Comparative Balance…
A: SOLUTION- A cash flow statement is a financial statement that summarizes the amount of cash and cash…
Q: Mulder Corporation's comparative balance sheets are presented below: MULDER CORPORATION Balance…
A: Given the following information: Mulder's 2017 income statement included net sales of $140,000,…
Q: Following is the balance sheet for 3M Company. At December 31 2015 2014 Cash and cash equivalents $…
A: Net Operating Assets for the year 2015 = $32718 (total assets) - $1798 (Cash and equivalents) - $118…
Q: A comparative balance sheet for Rocker Company appears below: ROCKER COMPANY Comparative…
A: Cash Flow Statement: -It is a statement that shows the cash movement (inflow or outflow) of cash…
Q: Required information [The following information applies to the questions displayed below.] Simon…
A: Compute the times-interest earned ratio for 2016:
Q: Required information [The following information applies to the questions displayed below.] Simon…
A: Calculation of days’ sales in inventory for 2016:
Q: Presented below are selected ledger accounts of Oriole Corporation as of December 31, 2017. Cash…
A: An income statement is the one prepared by the company to determine the company's financial…
Q: Just Dew It Corporation reports the following balance sheet information for 2017 and 2018. JUST…
A: Balance sheet of an entity shows its final and economic position.
Q: Use the following excerpts from Zowleski Company's financial information. Dec. 31, Dec. 31, 2018…
A: A cash flow statement shows the amount of net decrease or net increase in the cash balance during…
Q: Flounder Company has been operating for several years, and on December 31, 2017, presented the…
A:
Q: The following items and amounts were taken from Blossom Company's 2017 income statement and balance…
A: Income statement: The financial statement which reports revenues and expenses from business…
Q: Use the current asset section of the balance sheets of the Waverley Company as of June 30, 2017 and…
A: SOLUTION- HORIZONTAL ANALYSIS IS USED IN THE REVIEW OF THE COMPANY'S FINANCIAL STATEMENTS OVER…
Q: JKL Company COMPARATIVE BALANCE SHEET For the Year 2015 & 2016 Assets 2015 2016 Cash 290,000 120,000…
A: Accounts receivable ratio : It is an efficiency ratio that determines how well a company…
Q: Below are the 2014 and 2015 year-end balance sheets for Tran Enterprises: Assets: 2015 2014 Cash $…
A: As the balance sheet is an important financial statement it should be considered when any investment…
Q: The financial statements of ABC Co., appear below: ABC Co. Comparative Balance Sheet December…
A: We have the following information: Balance Sheet Income Statement Cash dividends of $50,000 were…
Q: Ivanhoe Automotive’s balance sheet at the end of its most recent fiscal year shows the following…
A: Answer - Calculation of Current Ratio - Current Ratio = Current Assets / Current Liabilities…
Q: Mulder Corporation's comparative balance sheets for year end at December 31, 2017 are presented…
A: We have the following information: Net sales (2017): $140,000 Cost of goods sold (2017): $80,000…
Q: Required information [The following information applies to the questions displayed below.] Simon…
A: Calculation of days’ sales uncollected for 2016:
Q: Selected comparative statement data for Rawan Products Company . All balance sheet data are as of…
A: Average common stockholders equity = (beginning common stockholders equity + ending common…
Prepare a statement of cash flows using indirect method


Trending now
This is a popular solution!

Step by step
Solved in 2 steps with 1 images


- Real-world annual report The financial statements for Nike, Inc. (NKE), are presented in Appendix E at the end of the text. The following additional information is available (in thousands): Instructions 1. Determine the following measures for the fiscal years ended May 31, 2017, and May 31, 2016. Round ratios and percentages to one decimal place. a. Working capital b. Current ratio c. Quick ratio d. Accounts receivable turnover e. Number of days sales in receivables f. Inventory turnover g. Number of days sales in inventory' h. Ratio of liabilities to stockholders equity i. Asset turnover j. Return on total assets, assuming interest expense is 82 million for the year ending May 31. 2017, and 33 million for the year ending May 31, 2016. k. k. Return on common stockholders equity l. Price-eamings ratio, assuming that the market price was 52.81 per share on May 31, 2017, and 54.35 per share on May 31, 2016. m. m. Percentage relationship of net income to sales 2. What conclusions can be drawn from these analyses?Financial statement analysis The financial statements for Nike, Inc., are presented in Appendix D at the end of the text. Use the following additional information (in thousands): Instructions 1. Determine the following measures for the fiscal years ended May 31, 2016, and May 31, 2015. Round ratios and percentages to one decimal place. a. Working capital b. Current ratio c. Quick ratio d. Accounts receivable turnover e. Number of days sales in receivables f. Inventory turnover g. Number of days sales in inventory h. Ratio of liabilities to stockholders equity i. Asset turnover j. Return on total assets. k. Return on common stockholders equity l. Price-earnings ratio, assuming that the market price was 54.90 per share on May 29, 2016, and 52.81 per share on May 30, 2015 m. Percentage relationship of net income to sales 2. What conclusions can be drawn from these analyses?Prince Corporations accounts provided the following information at December 31, 2019: What should be the current balance of retained earnings? a. 520,000 b. 580,000 c. 610,000 d. 670,000
- Comparative balance sheets for Hamilton Company are presented below. Hamilton Company Comparative Balance Sheet Decemebr 31 Assets 2017 2016 Cash 78000 12000 Accoutns Receivable 93000 76000 Inventory 180000 189000 Land 75000 100000 Equipemnt 250000 210000 Accu Dep - Equipment (66,000) (42,000) Total 610000 545000 Liability and Equity Accounts Payable 34000 47000 Bonds Payable 150000 200000 Common Stock ($1 Par ) 214000 164000 Retained Earnings 212000 134000 Total 610000 545000 Additional information: 1. Net income for 2017 was $134000 2. Cash dividends of $65,000 were declared and paid. 3. Bonds payable amounting to $50,000 were redeemed for cash $50,000.…Just Dew It Corporation reports the following balance sheet information for 2017 and 2018. JUST DEW IT CORPORATION2017 and 2018 Balance SheetsAssetsLiabilities and Owners' Equity 20172018 20172018 Current assets Current liabilities Cash$ 10,400 $ 10,450 Accounts payable$ 72,250 $ 62,750 Accounts receivable28,000 27,200 Notes payable47,000 47,750 Inventory63,900 63,100 Total $ 119,250 $ 110,500 Total $ 102,300 $ 100,750 Long-term debt$ 63,000 $ 64,700 Owners' equity Common stock and paid-in surplus$ 83,000 $ 83,000 Fixed assets Retained earnings 157,050 190,550 Net plant and equipment$ 320,000 $ 348,000 Total$ 240,050 $ 273,550 Total assets $ 422,300 $ 448,750 Total liabilities and owners' equity $ 422,300 $ 448,750 Based on the balance sheets given for Just Dew It, calculate the following financial…Wiemers Corporation’s comparative balance sheets are presented below. WIEMERS CORPORATIONBalance SheetsDecember 31 2017 2016 Cash $ 3,400 $ 4,000 Accounts receivable (net) 21,700 23,400 Inventory 10,200 7,500 Land 20,100 25,600 Buildings 69,700 69,700 Accumulated depreciation—buildings (15,500 ) (10,700 ) Total $109,600 $119,500 Accounts payable $ 12,000 $ 31,400 Common stock 75,600 69,200 Retained earnings 22,000 18,900 Total $109,600 $119,500 Wiemers’s 2017 income statement included net sales of $107,000, cost of goods sold of $59,700, and net income of $15,100.Compute the following ratios for 2017. (Round Debt to assets ratio to 1 decimal place, e.g. 1.6, or 1.6% and all other answers to 2 decimal places, e.g. 1.64, or 1.64% .) (a) Current ratio enter your answer rounded to 2 decimal places :1 (b) Acid-test ratio…
- Samuel Corp. has provided the following information for the year ended December 31, 2018. Samuel Corp Comparative Balance Sheet December 31, 2018 and 2017 2018 2017 Inc/(dec) Current Assets: Cash $33,000 $13,000 $20,000 Accounts Receiveable 29,000 36,000 (7,000) Inventory 56,000 29,000 27,000 Plant Assets, net 126,000 92,000 34,000 Total Assets $244,000 $170,000 $74,000 Accounts Payable $9,000 $13,000 $(4,000) Accrued Liabilities 7,000 3,000 4,000 Long-Term Notes Payable 70,000 79,000 (9,000) Total Liabilities 86,000 95,000 (9,000) Common Stock $55,000 $3,000 $52,000 Retained Earnings 115,000 78,000 37,000 Treasury Stock (12,000) (6,000) (6,000) Total Stockholders' Equity $158,000 $75,000 $83,000 Total Liabilities and Stockholders Equity $244,000 $170,000 $74,000 Samuel Corp Income…Shown below are comparative balance sheets for Sandhill Company. Sandhill CompanyComparative Balance SheetsDecember 31 Assets 2017 2016 Cash $ 211,208 $ 68,332 Accounts receivable 273,328 236,056 Inventory 518,702 587,034 Land 248,480 310,600 Equipment 807,560 621,200 Accumulated depreciation—equipment (204,996 ) (99,392 ) Total $1,854,282 $1,723,830 Liabilities and Stockholders’ Equity Accounts payable $ 121,134 $ 133,558 Bonds payable 465,900 621,200 Common stock ($1 par) 670,896 540,444 Retained earnings 596,352 428,628 Total $1,854,282 $1,723,830 Additional information: 1. Net income for 2017 was $288,858. 2. Depreciation expense was $105,604. 3. Cash dividends of $121,134 were declared and paid. 4. Bonds payable amounting to…Cullumber Company has these comparative balance sheet data: CULLUMBER COMPANYBalance SheetsDecember 31 2022 2021 Cash $ 16,350 $ 32,700 Accounts receivable (net) 76,300 65,400 Inventory 65,400 54,500 Plant assets (net) 218,000 196,200 $376,050 $348,800 Accounts payable $ 54,500 $ 65,400 Mortgage payable (15%) 109,000 109,000 Common stock, $10 par 152,600 130,800 Retained earnings 59,950 43,600 $376,050 $348,800 Additional information for 2022: 1. Net income was $34,000. 2. Sales on account were $383,300. Sales returns and allowances amounted to $26,600. 3. Cost of goods sold was $200,600. 4. Net cash provided by operating activities was $59,000. 5. Capital expenditures were $26,400, and cash dividends were $16,500. (d) Inventory turnover. enter inventory turnover in times rounded to 2 decimal places times (e)…
- Cullumber Company has these comparative balance sheet data: CULLUMBER COMPANYBalance SheetsDecember 31 2022 2021 Cash $ 16,350 $ 32,700 Accounts receivable (net) 76,300 65,400 Inventory 65,400 54,500 Plant assets (net) 218,000 196,200 $376,050 $348,800 Accounts payable $ 54,500 $ 65,400 Mortgage payable (15%) 109,000 109,000 Common stock, $10 par 152,600 130,800 Retained earnings 59,950 43,600 $376,050 $348,800 Additional information for 2022: 1. Net income was $34,000. 2. Sales on account were $383,300. Sales returns and allowances amounted to $26,600. 3. Cost of goods sold was $200,600. 4. Net cash provided by operating activities was $59,000. 5. Capital expenditures were $26,400, and cash dividends were $16,500. Compute the following ratios at December 31, 2022. (Round current ratio and inventory turnover to 2 decimal…The condensed financial statements of Marks Company for the years 2017-2018 are presented below: Marks CompanyComparative Balance SheetsAs of December 31, 2017 and 2018 2018 2017 Cash $404,000 $155,000 Accounts receivable (net) 356,000 300,000 Inventories 375,000 339,000 Plant and equipment 1,830,000 1,121,000 Accumulated depreciation (260,000 ) (193,000 ) $2,705,000 $1,722,000 Accounts payable $339,000 $164,000 Dividends payable -0- 45,000 Bonds payable 405,000 -0- Common stock ($10 par) 1,521,000 1,230,000 Retained earnings 440,000 283,000 $2,705,000 $1,722,000 Additional data: Market value of stock at 12/31/18 is $80 per share. Marks sold 30,000 shares of common stock at par on July 1, 2018. Marks CompanyCondensed…Selected comparative statement data for Oriole Company are presented below. All balance sheet data are as of December 31. 20222021Net sales$1,165,000 $1,125,000Cost of goods sold705,000 645,000Interest expense20,000 15,000Net income154,945 145,000Accounts receivable145,000 125,000Inventory105,000 100,000Total assets785,000 700,000Preferred stock (6%)205,000 200,000Total stockholders’ equity635,000 525,000 Compute the following ratios for 2022. (Round answers to 1 decimal place, e.g. 1.8 or 2.5%) (a)Profit marginenter the profit margin in percentages %(b)Asset turnoverenter the asset turnover in times times(c)Return on assetsenter the return on assets in percentages %(d)Return on common stockholders’ equityenter the return on common stockholders' equity in percentages %


