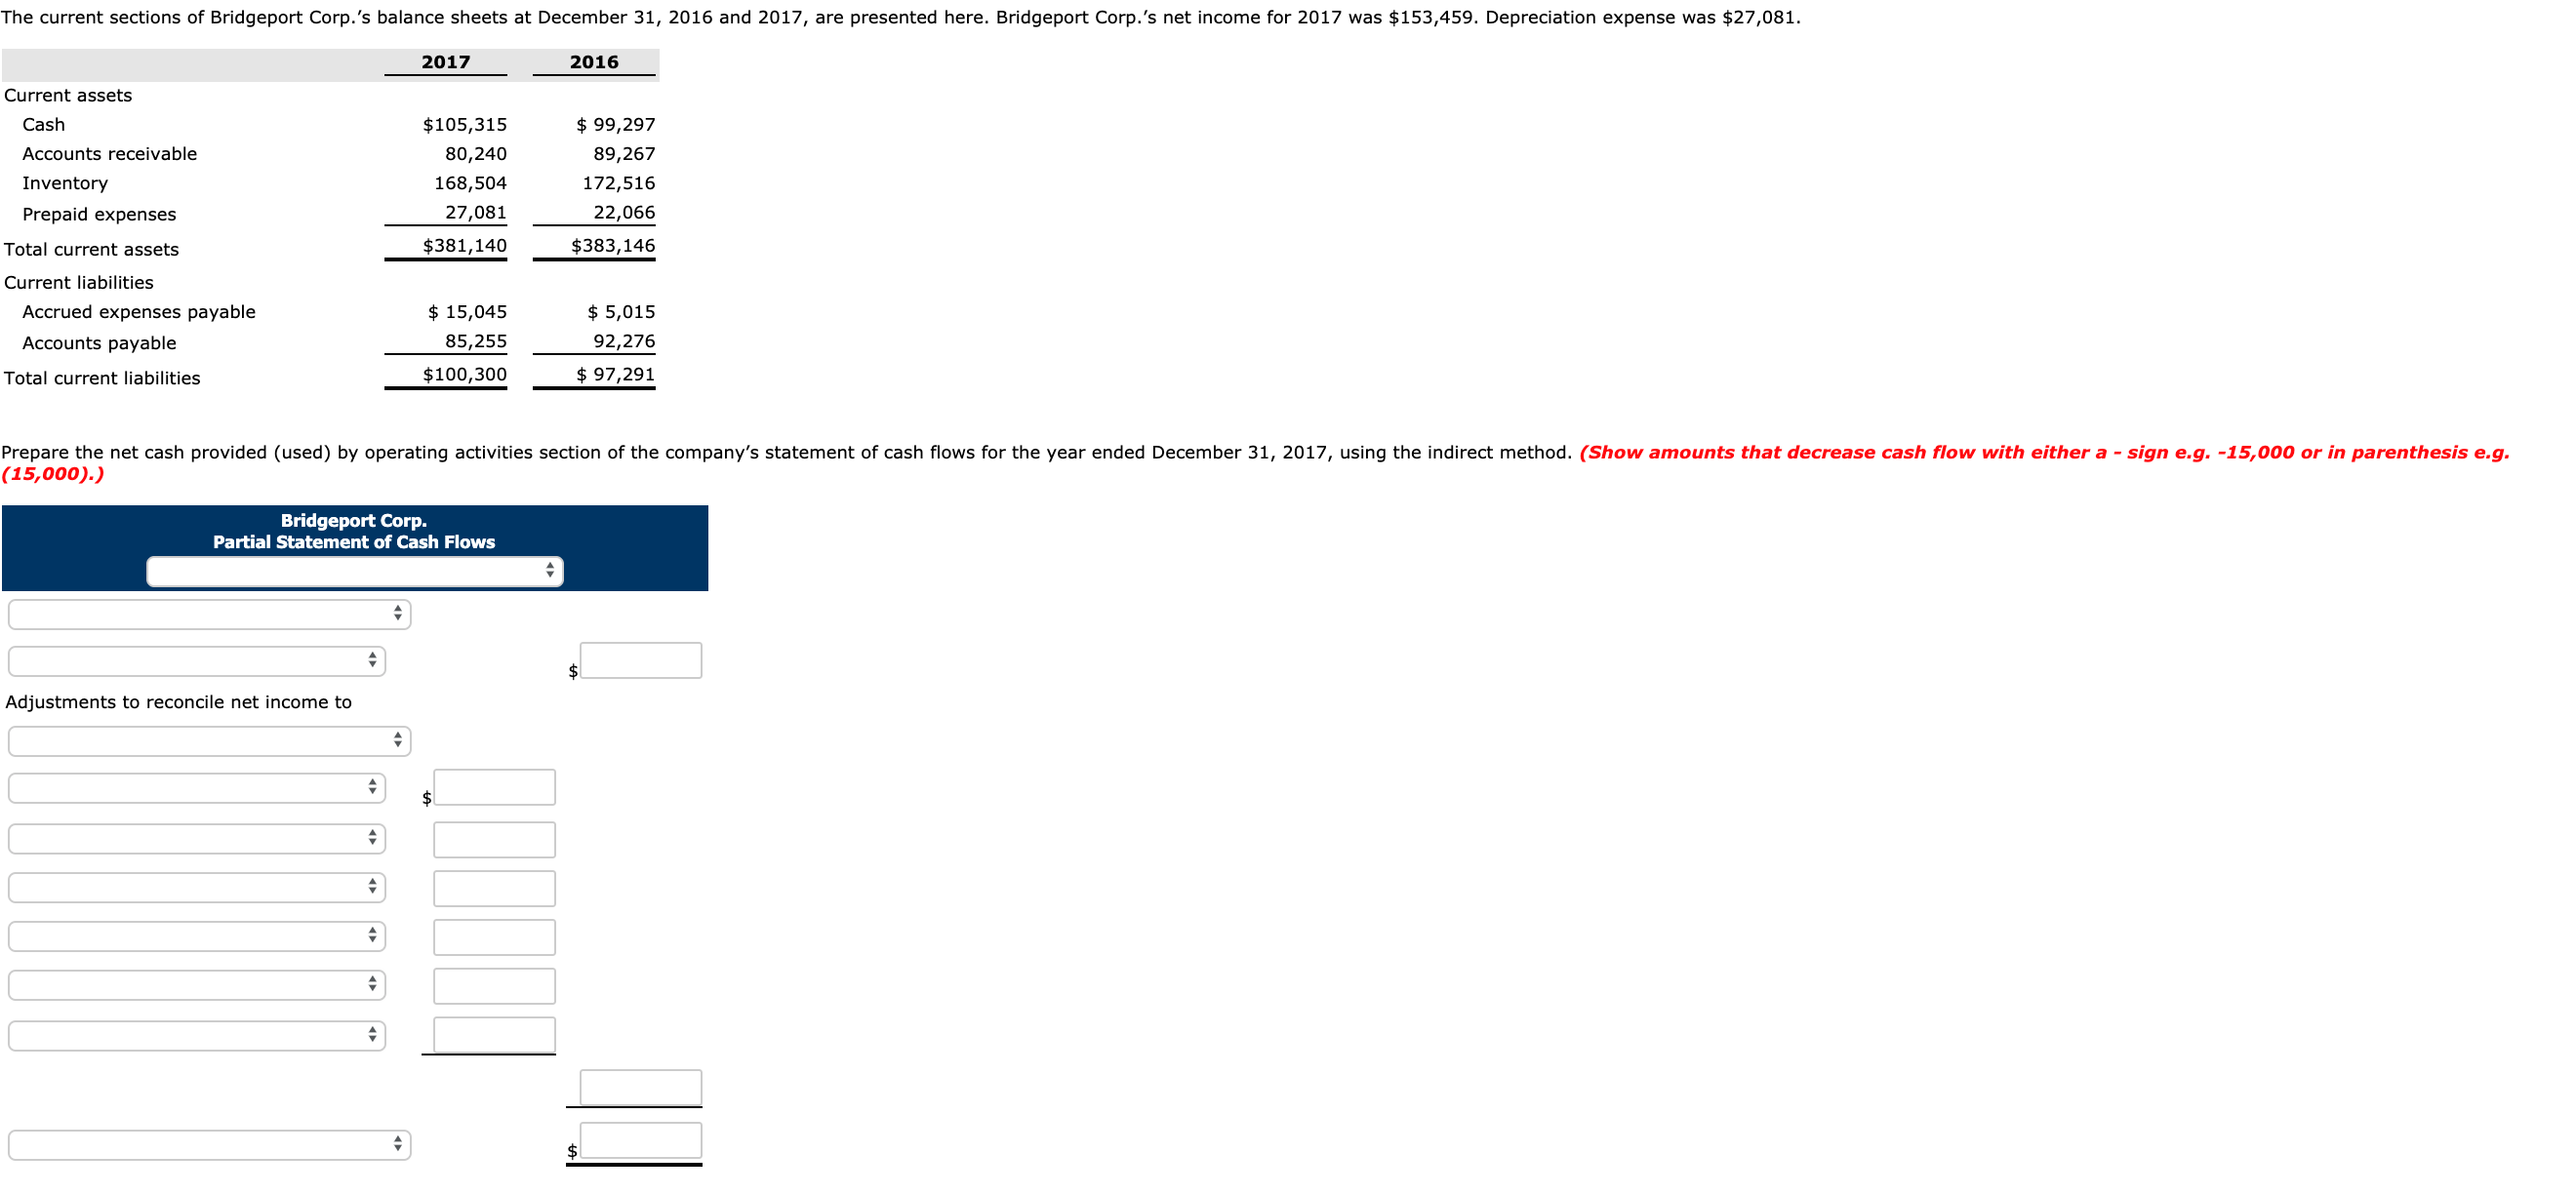
The current sections of Bridgeport Corp.'s balance sheets at December 31, 2016 and 2017, are presented here. Bridgeport Corp.'s net income for 2017 was $153,459. Depreciation expense was $27,081. 2017 2016 Current assets Cash $105,315 $ 99,297 Accounts receivable 80,240 89,267 Inventory 168,504 172,516 Prepaid expenses 27,081 22,066 Total current assets $381,140 $383,146 Current liabilities Accrued expenses payable $ 15,045 $ 5,015 Accounts payable 85,255 92,276 Total current liabilities $100,300 $ 97,291 ember 31, 2017, using Prepare the net cash provided (used) by operating activities section of the company's statement (15,000).) cash flows or the year ende indirect ethod. (Show am that decrease cash flow with either a - sign e.g. -15,000 or in parenthesis e.g. Bridgeport Corp. Partial Statement of Cash Flows $ Adjustments to reconcile net income to $ $1
Q: The following items and amounts were taken from Blossom Company's 2017 income statement and balance…
A: Assets: Assets are resources owned by business. It is of two types tangible assets and intangible…
Q: The comparative balance sheet of Whitman Co. at December 31, 2016 and 2015, is as follows: Dec.…
A: Statement of cash flows indicates cash inflow or outflows for the different three activities.…
Q: The 2017 annual report of Tootsie Roll Industries contains the following information. (in…
A: Since multiple subparts were posted, only the first three sub-parts will be answered.
Q: Birtle Corporation reports the following statement of financial position information for 2017 and…
A: Source or use of cash - Source or uses of cash means the increase or decrease in Assets or…
Q: Wiemers Corporation’s comparative balance sheets are presented below. WIEMERS CORPORATION Balance…
A: Current Ratio - Current ratio is the ratio of Current Assets and Current Liabilities. It measures…
Q: The condensed financial statements of Ivanhoe Company for the years 2016 and 2017 are presented as…
A: Since you have posted a question with multiple sub-parts, we will solve first three subparts for…
Q: Here are comparative statement data for Crane Company and Sheridan Company, two competitors. All…
A: Comparative balance sheet used to compare the financial statement of two or more periods. It is…
Q: Sage Hill Inc. had the following balance sheet at December 31, 2016. SAGE HILL INC. BALANCE…
A: 1. Plant Assets PARTICULAR DEBIT PARTICULAR CREDIT To balance B/d 35,500 By…
Q: The current sections of Teal Mountain Inc.’s balance sheets at December 31, 2016 and 2017, are…
A: Statement of cash flows: Statement of cash flow is a financial statement that shows the cash and…
Q: Required information [The following information applies to the questions displayed below.] Simon…
A: Compute the profit margin ratio for 2016:
Q: The following amounts were taken from the financial statements of Oriole Company: 2017 2016 Current…
A: Time interest earned ratio indicates the ability of the company to payout its debt obligation by…
Q: Required information [The following information applies to the questions displayed below.] Simon…
A: As per the requirement, we need to calculate return on total assets. The return on total assets can…
Q: Partial balance sheets and additional information are listed below for Funk Company. Funk…
A: Given, Sales = $820,000 Beginning accounts receivable = 90,800 Ending accounts receivable = 95,000…
Q: a) From the information above, prepare a statement of cash flows (indirect method) for Hartman,…
A: The Company has prepared the following comparative balance sheets for 2017 and 2018. Required (a)…
Q: A company had a $21,000 net loss from operations for 2016. Depreciation expenses for 2016 were…
A: Cash flow from operating activity is a part of the statement of cash flow. Operating activities…
Q: Required information [The following information applies to the questions displayed below.] Simon…
A: Calculate the average total assets for 2016:
Q: Current ratio. Inventory turnover. (Inventory on 12/31/16 was $340.) Profit margin. Return on…
A: Current ratio = Current AssetCurrent liabilities Inventory turnover ratio = Cost of goods…
Q: Presented here are an incomplete income statement and balance sheet for Vieux Corporation. VIEUX…
A: Ratio analysis is defined as a method utilized to analyze the results of a business. Various items…
Q: Required information [The following information applies to the questions displayed below.] Simon…
A: Compute the accounts receivable turnover ratio for 2016:
Q: Required information [The following information applies to the questions displayed below.] Simon…
A: Calculate the average inventory for 2016:
Q: The following information was obtained from the comparative financial statements included in…
A: "Since you have posted a question with multiple sub-parts, we will solve first three sub-parts for…
Q: Partial balance sheets and additional information are listed below for Monaco Company. Monaco…
A: Cash paid to supplies = Net purchase + Beginning balance of accounts payable - + Ending balance of…
Q: equired information [The following information applies to the questions displayed below.] Simon…
A: Compute the debt-to-equity for 2016:
Q: The net changes in the statement of financial position accounts of Solar Services, Inc. for the year…
A: The cash flow statement indicates the flow of cash and cash and cash equivalents during the given…
Q: Gwynett Corporation comparative balance sheets at December 31: 2016 175,000 248,000 465,000…
A: Statement of cash flows is the financial statement which shows all cash inflows and cash outflows of…
Q: Use the following information to answer this question. Bayside, Inc. 2017 Income Statement ($ in…
A: Given, The net income is $987 The common stock in the year 2016 is $3,240 The common stock in the…
Q: The comparative balance sheets for Russell Company appear below: RUSSELL COMPANY Comparative Balance…
A: Cash flow statement is a statement showing the inflow and outflow of cash from the three main…
Q: he following information to answer this question. Windswept, Inc. 2017 Income Statement ($ in…
A: Quick ratio = Quick Assets / Current liabilities
Q: Asset turnnover Debt to asset ratio Free cash flow
A: Financial ratios refer to the comparison between the various elements of the financial statement.…
Q: Use the following tables to answer the question: LOGIC COMPANY Income Statement For years ended…
A: Given the following information:
Q: Comparative financial statement data for Flounder Corp. and Blue Spruce Corp., two competitors,…
A: Ratio Analysis: Ratio analysis is a process of determining the relationship between accounting…
Q: 1. Using the information provided, compute the following for 2017 and 2016: d. Cash flow from…
A: 1. d. Particulars 2017 2016 Cash flow from operations(A) 18700 16000 Capital expenditures(B)…
Q: equired information [The following information applies to the questions displayed below.] Simon…
A: Compute the debt-to-equity for 2016:
Q: (Classification of Transactions) Following are selected balance sheet accounts of Allman Bros. Corp.…
A: Compute the category and the amount that should be reported in the statement of cash flows as shown…
Q: Following is the balance sheet for 3M Company. At December 31 2015 2014 Cash and cash equivalents $…
A: Net Operating Assets for the year 2015 = $32718 (total assets) - $1798 (Cash and equivalents) - $118…
Q: The condensed financial statements of Soule Company for the years 2013 and 2014 are presented below.…
A: We need the following information: Total Current Assets (2014): £1,350 Total Current Liabilities…
Q: A comparative balance sheet for Rocker Company appears below: ROCKER COMPANY Comparative…
A: Cash Flow Statement: -It is a statement that shows the cash movement (inflow or outflow) of cash…
Q: Required information [The following information applies to the questions displayed below.] Simon…
A: Compute the times-interest earned ratio for 2016:
Q: Required information [The following information applies to the questions displayed below.] Simon…
A: Calculation of days’ sales in inventory for 2016:
Q: Just Dew It Corporation reports the following balance sheet information for 2017 and 2018. JUST…
A: Balance sheet of an entity shows its final and economic position.
Q: Shown below are comparative balance sheets for Sandhill Company. Sandhill CompanyComparative…
A: Cash Flow Statements Cash flow statement provides information regarding cash generated or used…
Q: Use the following information to answer this question. Windswept, Inc. 2017 Income Statement…
A: Given: Net income = $1,051 million Number of shares = 520 million Price - earning ratio = 20
Q: The following balance sheet is for the Ballyhoo Company forfiscal year-end 2014. Please fill in all…
A: Equity capital is the funds invested by the owners of the company. The equity holders of the owners…
Q: Use the current asset section of the balance sheets of the Waverley Company as of June 30, 2017 and…
A: SOLUTION- HORIZONTAL ANALYSIS IS USED IN THE REVIEW OF THE COMPANY'S FINANCIAL STATEMENTS OVER…
Q: Use the following information to answer this question. Windswept, Inc. 2017 Income Statement ($…
A: Equity multiplier is a ratio calculated to use see the company used it for how much assets are used…
Q: Locker Company’s income statement and comparative balance sheets follow. During 2017, the…
A: Cash flow statement: It is a statement which reports the cash inflows and outflows of a business…
Q: Presented below is a condensed version of the comparative balance sheets for Pronghorn Corporation…
A: Free cash flows - Free cash flows are the cash left after cash used for operating activities and…
Q: Use the following information to answer this question. Windswept, Inc. 2017 Income Statement ($ in…
A: The quick ratio is a part of the liquidity ratio. The liquidity ratio indicates the liquidity of the…
Q: Required information [The following information applies to the questions displayed below.] Simon…
A: Calculation of days’ sales uncollected for 2016:
Trending now
This is a popular solution!
Step by step
Solved in 3 steps with 2 images
- The comparative balance sheet of Prime Sports Gear, Inc., at December 31, the end of the fiscal year, is as follows: Additional data obtained from the records of Prime Sports Gear are as follows: a. Net income for 2013 was 121,610. b. Depreciation reported on income statement for 2013 was 46,500. c. Purchased 165,000 of new equipment, putting 90,000 cash down and issuing 75,000 of bonds for the balance. d. Old equipment originally costing 19,500, with accumulated depreciation of 7,950, was sold for 8,000. e. Retired 60,000 of bonds. f. Declared cash dividends of 64,000. g. Issued 1,500 shares of common stock at 27 cash per share. Open the file CASHFLOW from the website for this book at cengagebrain.com. First, enter the formulas. Then, complete the worksheet in the manner described next. According to the problem, cash increased from 39,600 to 67,210 during the year. This is a 27,610 increase. To record this increase on the worksheet, move to row 17. Since this is the first account you are analyzing, enter the letter a in column C. Then enter 27610 in column D (a debit since cash increased). This brings the year-end balance (column G) to 67,210, its proper balance. Now move to the bottom part of the statement where you see the categories Operating Activities, Investing Activities, and so on. The credit side of the entry has to be entered here. The proper space for this cash entry is on row 59. Enter the letter a in cell E59 and 27610 in cell F59. Notice the totals at the bottom of the page (row 60) now agree. The next account balance that changed is accounts receivable. It increased by 9,035. To enter this change on the worksheet, enter the letter b in cell C18 and 9035 in cell D18 (again, a debit since accounts receivable increased). This brings the year-end balance in column G to 121,250, its proper balance. The change in accounts receivable balance is an operating activity adjustment (as explained in your textbook). Enter the credit side of this entry in cells E34 and F34, and enter the explanation Increase in accounts receivable in cell A34. Note: Your textbook probably shows Net income as the first item under Operating Activities. We will get to that later. The sequence in which you enter items on this worksheet is not important. All other balance sheet accounts must be analyzed in the same manner, placing appropriate debit or credit entries in the top part of the worksheet to obtain the proper balances in column G, and then entering the second side of the entry in the appropriate row on the bottom part of the worksheet. You should use letter references to identify all entries. Also, you must enter a description of the entry in column A under the appropriate activity category. Although a sequence of analyzing the balance sheet from top to bottom is suggested here, this order is not necessary. As mentioned earlier, your textbook may specify a different sequence. Also, note that some accounts may have both debit and credit adjustments to them. The worksheet is not a substitute for a statement of cash flows, but it does provide you with all the numbers you need to properly prepare one. You will be done with your analysis when: a. The individual account balances at December 31, 2013, as shown on the worksheet (column G) equal those shown in the given problem data. b. The transaction column totals are equal (cells D60 and F60). c. The sum of the operating, investing, and financing activities (cell G59) equals the change in cash (cell D59 or F59). When you are finished, enter your name in cell A1. Save your completed file as CASHFLOW2. Print the worksheet when done. Also print your formulas. Check figure: Total credits at 12/31/2013 (cell G31), 860,460.The comparative balance sheet of Prime Sports Gear, Inc., at December 31, the end of the fiscal year, is as follows: Additional data obtained from the records of Prime Sports Gear are as follows: a. Net income for 2013 was 121,610. b. Depreciation reported on income statement for 2013 was 46,500. c. Purchased 165,000 of new equipment, putting 90,000 cash down and issuing 75,000 of bonds for the balance. d. Old equipment originally costing 19,500, with accumulated depreciation of 7,950, was sold for 8,000. e. Retired 60,000 of bonds. f. Declared cash dividends of 64,000. g. Issued 1,500 shares of common stock at 27 cash per share. You have been asked to prepare a statement of cash flows for Prime Sports Gear for 2013. Review the worksheet called CASHFLOW that has been provided to assist you in preparing the statement. The worksheet has been designed so that as you make entries in columns D and F, column G will be automatically updated. For example, FORMULA1 should be entered as =B17+D17F17. Columns C and E are to be used to enter letter references for each of the debit and credit entries on the worksheet.The current sections of Teal Mountain Inc.’s balance sheets at December 31, 2016 and 2017, are presented here. Teal Mountain Inc.’s net income for 2017 was $156,366. Depreciation expense was $27,594. 2017 2016Current assets Cash $107,310 $ 101,178Accounts receivable 81,760 90,958Inventory 171,696 175,784Prepaid expenses 27,594 22,484Total current assets $388,360 $390,404Current liabilities Accrued expenses payable $ 15,330 $ 5,110Accounts payable 86,870 94,024Total current liabilities $102,200 $ 99,134 Prepare the net cash provided (used) by operating activities section of the company’s statement of cash flows for the year ended December 31, 2017, using the indirect method. (Show amounts that decrease cash flow with either a - sign e.g. -15,000 or in parenthesis e.g. (15,000).)
- Use the current asset section of the balance sheets of the Waverley Company as of June 30, 2017 and 2016 presented below to answer the questions that follow. 2017 2016Cash and cash equivalents R 75,000 R 58,800Trade accounts receivable, net 157,500 193,200Inventory 208,200 253,400Other current assets 18,400 15,500Total current assets R 459,100 R 520,900Total assets R2,650,000 R3,430,000Required:Complete a horizontal analysis of the current asset section of Waverley Company’s balance sheet for 2017. Your answers for “% Change” should be rounded to one decimal place, e.g.,…Current Attempt in Progress Presented below are a number of balance sheet items for Culver, Inc. for the current year, 2017. Goodwill $ 211,800 Accumulated depreciation-equipment $ 467,100 Payroll taxes payable 67,100 Inventory 400,400 Bonds payable 501,800 Rent payable (short-term) 41,800 Discount on bonds payable 35,100 Income tax payable 112,600 Cash 62,800 Rent payable (long-term) 81,800 Land 352,800 Common stock, $1 par value 251,800 Notes receivable 162,300 Preferred stock, $25 par value 1,251,800 Notes payable (to banks) 266,700 Prepaid expenses 70,560 Accounts payable 348,800 Equipment 1,387,800 Retained earnings ? Equity investments (trading) 376,800 Income taxes receivable 47,400 Accumulated depreciation-buildings 361,300 Unsecured notes payable (long-term) 1,301,800 Buildings 2,801,800 Prepare a classified…Financial information for Powell Panther Corporation is shown below: Powell Panther Corporation: Income Statements for Year Ending December 31 (Millions of Dollars) 2018 2017 Sales $ 3,900.0 $ 3,000.0 Operating costs excluding depreciation and amortization 2,925.0 2,550.0 EBITDA $ 975.0 $ 450.0 Depreciation and amortization 90.0 69.0 Earnings before interest and taxes (EBIT) $ 885.0 $ 381.0 Interest 86.0 66.0 Earnings before taxes (EBT) $ 799.0 $ 315.0 Taxes (40%) 319.6 126.0 Net income $ 479.4 $ 189.0 Common dividends $ 431.0 $ 151.0 Powell Panther Corporation: Balance Sheets as of December 31 (Millions of Dollars) 2018 2017 Assets Cash and equivalents $ 38.0 $ 30.0 Accounts receivable 432.0 360.0 Inventories 819.0 630.0 Total current assets $ 1,289.0 $ 1,020.0 Net plant and equipment 897.0 690.0 Total assets $ 2,186.0 $ 1,710.0 Liabilities and Equity…
- The condensed financial statements of Marks Company for the years 2017-2018 are presented below: Marks CompanyComparative Balance SheetsAs of December 31, 2017 and 2018 2018 2017 Cash $404,000 $155,000 Accounts receivable (net) 356,000 300,000 Inventories 375,000 339,000 Plant and equipment 1,830,000 1,121,000 Accumulated depreciation (260,000 ) (193,000 ) $2,705,000 $1,722,000 Accounts payable $339,000 $164,000 Dividends payable -0- 45,000 Bonds payable 405,000 -0- Common stock ($10 par) 1,521,000 1,230,000 Retained earnings 440,000 283,000 $2,705,000 $1,722,000 Additional data: Market value of stock at 12/31/18 is $80 per share. Marks sold 30,000 shares of common stock at par on July 1, 2018. Marks CompanyCondensed…The comparative statement of financial position for Cullumber Corporation shows the following noncash current asset and liability accounts at March 31: 2018 2017 Accounts receivable $61,000 $43,000 Inventory 70,000 64,000 Accounts payable 35,000 43,000 Dividends payable 1,400 2,300 Cullumber’s income statement reported the following selected information for the year ended March 31, 2018: net income was $280,000, depreciation expense was $60,000, and a loss on the disposal of land was $18,000. Cullumber uses a perpetual inventory system. Calculate net cash provided (used) by operating activities using the indirect method. (Show amounts that decrease cash flow with either a - sign e.g. -15,000 or in parenthesis e.g. (15,000).) CULLUMBER CORPORATIONStatement of Cash Flows (Partial)-Indirect Method Operating activities…Financial information for Powell Panther Corporation is shown below: Powell Panther Corporation: Income Statements for Year Ending December 31 (Millions of Dollars) 2018 2017 Sales $ 1,800.0 $ 1,500.0 Operating costs excluding depreciation and amortization 1,395.0 1,275.0 EBITDA $ 405.0 $ 225.0 Depreciation and amortization 43.0 39.0 Earnings before interest and taxes (EBIT) $ 362.0 $ 186.0 Interest 40.0 33.0 Earnings before taxes (EBT) $ 322.0 $ 153.0 Taxes (40%) 128.8 61.2 Net income $ 193.2 $ 91.8 Common dividends $ 174.0 $ 73.0 Powell Panther Corporation: Balance Sheets as of December 31 (Millions of Dollars) 2018 2017 Assets Cash and equivalents $ 23.0 $ 18.0 Accounts receivable 248.0 225.0 Inventories 396.0 360.0 Total current assets $ 667.0 $ 603.0 Net plant and equipment 429.0 390.0 Total assets $ 1,096.0 $ 993.0 Liabilities and Equity Accounts…
- Presented below are a number of balance sheet items for Culver, Inc. for the current year, 2017. Goodwill $ 211,800 Accumulated depreciation-equipment $ 467,100 Payroll taxes payable 67,100 Inventory 400,400 Bonds payable 501,800 Rent payable (short-term) 41,800 Discount on bonds payable 35,100 Income tax payable 112,600 Cash 62,800 Rent payable (long-term) 81,800 Land 352,800 Common stock, $1 par value 251,800 Notes receivable 162,300 Preferred stock, $25 par value 1,251,800 Notes payable (to banks) 266,700 Prepaid expenses 70,560 Accounts payable 348,800 Equipment 1,387,800 Retained earnings ? Equity investments (trading) 376,800 Income taxes receivable 47,400 Accumulated depreciation-buildings 361,300 Unsecured notes payable (long-term) 1,301,800 Buildings 2,801,800 Prepare a classified balance sheet in good form. Common stock…Financial information for Powell Panther Corporation is shown below: Powell Panther Corporation: Income Statements for Year Ending December 31 (Millions of Dollars) 2018 Sales $ 1,625.0 $ 2017 1,300.0 Operating costs excluding depreciation and amortization 1,300.0 1,105.0 EBITDA $ 325.0 $ 195.0 Depreciation and amortization 39.0 31.0 Earnings before interest and taxes (EBIT) $ 286.0 $ 164.0 Interest 36.0 29.0 Earnings before taxes (EBT) $ 250.0 $ 135.0 Taxes (40%) 100.0 54.0 Net income $ 150.0 $ 81.0 Common dividends $ 135.0 $ 65.0 Powell Panther Corporation: Balance Sheets as of December 31 (Millions of Dollars) 2018 Assets Cash and equivalents $ 23.0 $ 2017 18.0 Accounts receivable 164.0 143.0 Inventories 343.0 312.0 Total current assets $ 530.0 $ 473.0 Net plant and equipment 390.0 312.0 Total assets $ 920.0 $ 785.0 Liabilities and Equity…Shown below are comparative balance sheets for Sandhill Company. Sandhill CompanyComparative Balance SheetsDecember 31 Assets 2017 2016 Cash $ 211,208 $ 68,332 Accounts receivable 273,328 236,056 Inventory 518,702 587,034 Land 248,480 310,600 Equipment 807,560 621,200 Accumulated depreciation—equipment (204,996 ) (99,392 ) Total $1,854,282 $1,723,830 Liabilities and Stockholders’ Equity Accounts payable $ 121,134 $ 133,558 Bonds payable 465,900 621,200 Common stock ($1 par) 670,896 540,444 Retained earnings 596,352 428,628 Total $1,854,282 $1,723,830 Additional information: 1. Net income for 2017 was $288,858. 2. Depreciation expense was $105,604. 3. Cash dividends of $121,134 were declared and paid. 4. Bonds payable amounting to…