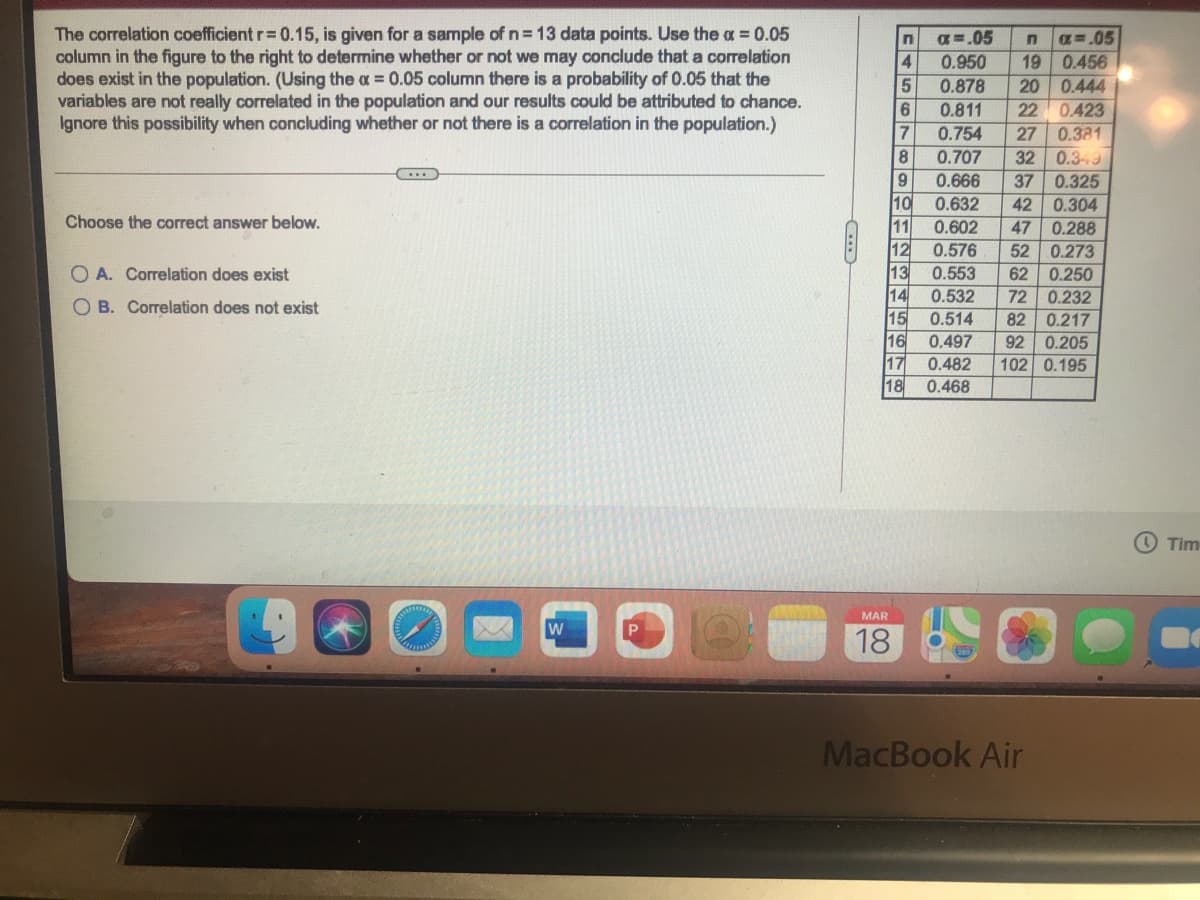
The correlation coefficient r=0.15, is given for a sample of n= 13 data points. Use the a = 0.05 column in the figure to the right to determine whether or not we may conclude that a correlation does exist in the population. (Using the a = 0.05 column there is a probability of 0.05 that the variables are not really correlated in the population and our results could be attributed to chance. Ignore this possibility when concluding whether or not there is a correlation in the population.) a=.05 0.950 g=.05 19 0.456 20 0.444 4. 5 0.878 6. 0.811 0.423 0.381 32 0.349 22 0.754 0.707 0.666 27 8 9 37 0.325 10 0.632 42 0.304 Choose the correct answer below. 11 0.602 47 0.288 0.576 12 13 52 0.273 O A. Correlation does exist 0.553 14 62 0.250 0.532 15 16 17 18 72 0.232 O B. Correlation does not exist 0.514 82 0.217 0.497 92 0.205 102 0.195 0.482 0.468
The correlation coefficient r=0.15, is given for a sample of n= 13 data points. Use the a = 0.05 column in the figure to the right to determine whether or not we may conclude that a correlation does exist in the population. (Using the a = 0.05 column there is a probability of 0.05 that the variables are not really correlated in the population and our results could be attributed to chance. Ignore this possibility when concluding whether or not there is a correlation in the population.) a=.05 0.950 g=.05 19 0.456 20 0.444 4. 5 0.878 6. 0.811 0.423 0.381 32 0.349 22 0.754 0.707 0.666 27 8 9 37 0.325 10 0.632 42 0.304 Choose the correct answer below. 11 0.602 47 0.288 0.576 12 13 52 0.273 O A. Correlation does exist 0.553 14 62 0.250 0.532 15 16 17 18 72 0.232 O B. Correlation does not exist 0.514 82 0.217 0.497 92 0.205 102 0.195 0.482 0.468

Glencoe Algebra 1, Student Edition, 9780079039897, 0079039898, 2018
18th Edition
ISBN:9780079039897
Author:Carter
Publisher:Carter
Chapter10: Statistics
Section10.1: Measures Of Center
Problem 9PPS

Related questions
Question
Transcribed Image Text:The correlation coefficient r=0.15, is given for a sample of n= 13 data points. Use the a = 0.05
column in the figure to the right to determine whether or not we may conclude that a correlation
does exist in the population. (Using the a = 0.05 column there is a probability of 0.05 that the
variables are not really correlated in the population and our results could be attributed to chance.
Ignore this possibility when concluding whether or not there is a correlation in the population.)
a=.05
0.950
=.05
4.
19 0.456
5
0.878
20 0.444
22 0.423
27 0.381
6.
0.811
0.754
8
0.707
32
0.349
0.325
0.304
9
0.666
37
10
0.632
42
Choose the correct answer below.
11
0.602
47
0.288
12
0.576
52
0.273
O A. Correlation does exist
13
0.553
62
0.250
14
0.532
72 0.232
O B. Correlation does not exist
15
16
17
0.514
82
92 0.205
102 0.195
0.217
0.497
0.482
18
0.468
O Tim
MAR
18
MacBook Air
Expert Solution
This question has been solved!
Explore an expertly crafted, step-by-step solution for a thorough understanding of key concepts.

Step by step
Solved in 2 steps

Recommended textbooks for you
Glencoe Algebra 1, Student Edition, 9780079039897…
Algebra
ISBN:
9780079039897
Author:
Carter
Publisher:
McGraw Hill
Glencoe Algebra 1, Student Edition, 9780079039897…
Algebra
ISBN:
9780079039897
Author:
Carter
Publisher:
McGraw Hill