The data below are total home game playing times (hours) for all Major League Basebal teams in a recent year. 236 237 238 239 241 241 | 242 | 245 245 245 246 247 247 248 248 249 250 250 250 251 252 252 253 | 253 258 258 | 258 | 260 262 264 Construct a frequency distribution. Use a class width of 5 hours and use a starting time of 235 hours.
The data below are total home game playing times (hours) for all Major League Basebal teams in a recent year. 236 237 238 239 241 241 | 242 | 245 245 245 246 247 247 248 248 249 250 250 250 251 252 252 253 | 253 258 258 | 258 | 260 262 264 Construct a frequency distribution. Use a class width of 5 hours and use a starting time of 235 hours.

Glencoe Algebra 1, Student Edition, 9780079039897, 0079039898, 2018
18th Edition
ISBN:9780079039897
Author:Carter
Publisher:Carter
Chapter10: Statistics
Section10.6: Summarizing Categorical Data
Problem 4CGP

Related questions
Question
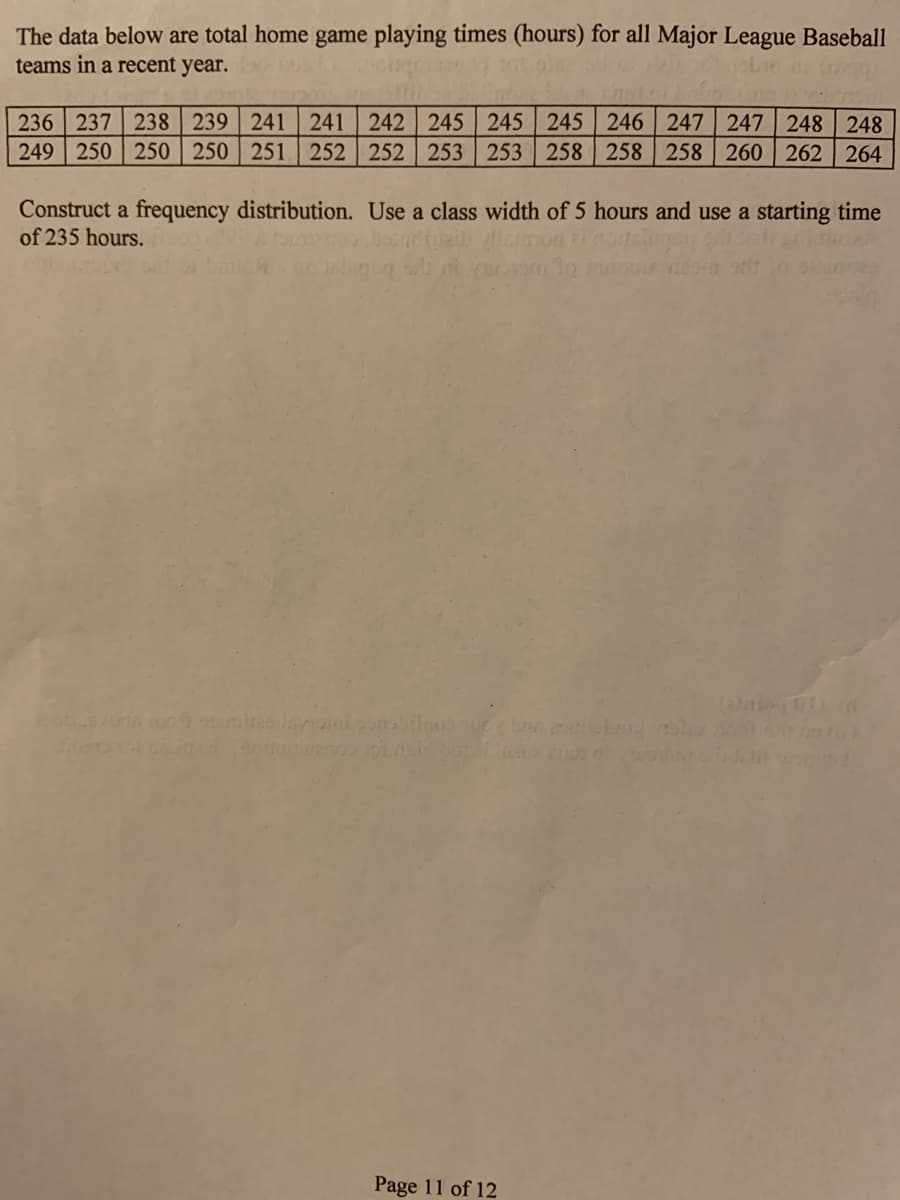
Transcribed Image Text:The data below are total home game playing times (hours) for all Major League Baseball
teams in a recent year.
236 237 238 239 241
249 250 250 | 250 | 251 252 252 253 253 258 258 258 260 262 264
241 242 245 245 245 246 247 247 248 248
Construct a frequency distribution. Use a class width of 5 hours and use a starting time
of 235 hours.
Page 11 of 12
Expert Solution
This question has been solved!
Explore an expertly crafted, step-by-step solution for a thorough understanding of key concepts.

This is a popular solution!

Trending now
This is a popular solution!

Step by step
Solved in 2 steps

Knowledge Booster


Learn more about
Need a deep-dive on the concept behind this application? Look no further. Learn more about this topic, statistics and related others by exploring similar questions and additional content below.Recommended textbooks for you
Glencoe Algebra 1, Student Edition, 9780079039897…
Algebra
ISBN:
9780079039897
Author:
Carter
Publisher:
McGraw Hill
Glencoe Algebra 1, Student Edition, 9780079039897…
Algebra
ISBN:
9780079039897
Author:
Carter
Publisher:
McGraw Hill