
MATLAB: An Introduction with Applications
6th Edition
ISBN: 9781119256830
Author: Amos Gilat
Publisher: John Wiley & Sons Inc
expand_more
expand_more
format_list_bulleted
Related questions
Question
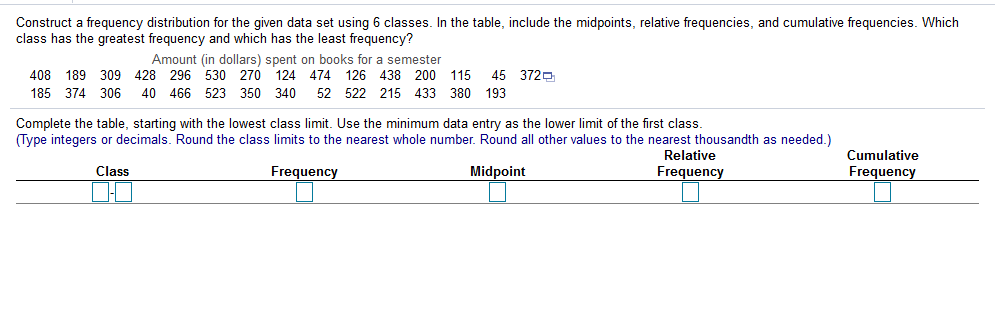

Transcribed Image Text:Construct a frequency distribution for the given data set using 6 classes. In the table, include the midpoints, relative frequencies, and cumulative frequencies. Which
class has the greatest frequency and which has the least frequency?
Amount (in dollars) spent on books for a semester
408 189 309 428 296 530 270 124 474 126 438 200 115
45 3720
185 374 306
40 466 523 350 340
52 522 215 433 380 193
Complete the table, starting with the lowest class limit. Use the minimum data entry as the lower limit of the first class.
(Type integers or decimals. Round the class limits to the nearest whole number. Round all other values to the nearest thousandth as needed.)
Relative
Cumulative
Class
Frequency
Midpoint
Frequency
Frequency
Expert Solution
This question has been solved!
Explore an expertly crafted, step-by-step solution for a thorough understanding of key concepts.

This is a popular solution

Trending nowThis is a popular solution!

Step by stepSolved in 2 steps with 4 images

Knowledge Booster


Learn more about
Need a deep-dive on the concept behind this application? Look no further. Learn more about this topic, statistics and related others by exploring similar questions and additional content below.Similar questions
- Use the frequency histogram to complete the following parts. (a) Determine the number of classes. (b) Estimate the greatest and least frequencies. (c) Determine the class width. (d) Describe any patterns with the data. Frequency Employee Salaries 300- 200- 100- ☑ 0 32 37 42 47 52 57 62 Salary (in thousands of dollars) (a) There are classes. (Type a whole number.) (b) The least frequency is about (Round to the nearest whole number as needed.) The greatest frequency is about (Round to the nearest whole number as needed.) (c) The class width is (Type an integer or a decimal. Do not round.) (d) What pattern does the histogram show? A. About half of the employees' salaries are between $50,000 and $59,000. B. About half of the employees' salaries are between $40,000 and $49,000. C. Less than half of the employees make between $35,000 and $59,000. D. Most employees make less than $34,000 or more than $60,000.arrow_forwardThe following data represents the age of 30 lottery winners. 24 25 28 33 35 36 36 43 45 49 56 59 59 60 60 62 69 69 70 70 70 71 73 73 74 75 75 76 78 84 Find the range of the data:arrow_forwardUse the following table: $386 $328 $265 $428 $245 446 254 587 326 345 417 326 312 363 385 Prepare a frequency distribution from the above weekly salaries of teachers at Pikes Peak Community College. Use the following intervals: Salaries. Frequency $200 - $299.99. ?? 300 - 399.99. ?? 400 - 499.99. ?? 500 - 599.99. ??arrow_forward
- Use the following table: $ 210 290 286 $ 505 480 410 $ 310 550 305 $ 380 490 $ 275 444 200 368 Prepare a frequency distribution from the above weekly salaries of teachers at Moore Community College. Use the following intervals: Salaries $200-$299.99 ces 300-399.99 400-499.99 500-599.99 Frequencyarrow_forward3. Create a frequency histogram from the given data frequency table. X 42 48 51 57 63 68 70 79 82 95 s 1 2 1 4 1 4 1 2 1 1arrow_forwardplease help. thank youarrow_forward
- Use the same scales to construct boxplots for the pulse rates of males and females from the accompanying data sets. Use the boxplots to compare the two data sets. Click the icon to view the data sets. Men's Pulse Rates 62 60 70 70 62 86 82 77 76 74 Full data set 87 53 90 65 69 56 80 61 76 80 53 60 67 63 62 49 70 60 70 56 64 77 67 60 69 73 73 62 50 57 Women's Pulse Rates 78 68 70 70 77 76 98 70 66 78 70 58 74 77 78 92 95 60 100 100 77 64 84 63 72 77 75 90 88 73 83 71 76 103 62 70 70 89 74 80 Choose the graphs that represent (picture attached!!) Compare the two boxplots. Choose the correct answer below. A. In general, it appears that males have higher pulse rates than females. The variation among the male pulse rates is much greater…arrow_forwardThe table below has a total of 63 values. Find the 8th decile for the following Grouped Frequency Data Table (GFDT). Lower Class Limit Upper Class Limit Frequency 50 54 8 55 59 6 60 64 5 65 69 5 70 74 7 75 79 7 80 84 8 85 89 4 90 94 13 The 8th decile =arrow_forwardFind the percentil for the data point. Data set: 5 12 9 7 5 5 12 7 5 12 2 12 15 6 9 5 12 9 7 12;data point 6arrow_forward
- Scores: 43 68 20 33 3947 60 40 47 8180 67 48 78 4855 69 55 55 5770 80 63 71 6362 69 70 39 5740 62 25 62 5257 54 46 81 4679 46 52 63 2861 37 59 48 55 Requirements to do: • Frequency distribution• Graphical Presentation (Pie, Line, Bar and Ogives)• Mean, Median, Mode for Grouped Dataarrow_forward25arrow_forwardThe data represent the time, in minutes, spent reading a political blog in a day. Construct a frequency distribution using 5 classes. In the table, include the midpoints, relative frequencies, and cumulative frequencies. Which class has the greatest frequency and which has the least frequency? 34 22 15 24 49 48 8 2 16 30 36 30 11 24 38 23 Complete the table, starting with the lowest class limit. (Simplify your answers.) Relative Cumulative Class Frequency Midpoint Frequency Frequencyarrow_forward
arrow_back_ios
SEE MORE QUESTIONS
arrow_forward_ios
Recommended textbooks for you
- MATLAB: An Introduction with ApplicationsStatisticsISBN:9781119256830Author:Amos GilatPublisher:John Wiley & Sons Inc
 Probability and Statistics for Engineering and th...StatisticsISBN:9781305251809Author:Jay L. DevorePublisher:Cengage Learning
 Statistics for The Behavioral Sciences (MindTap C...StatisticsISBN:9781305504912Author:Frederick J Gravetter, Larry B. WallnauPublisher:Cengage Learning
  Elementary Statistics: Picturing the World (7th E...StatisticsISBN:9780134683416Author:Ron Larson, Betsy FarberPublisher:PEARSON
 The Basic Practice of StatisticsStatisticsISBN:9781319042578Author:David S. Moore, William I. Notz, Michael A. FlignerPublisher:W. H. Freeman
 Introduction to the Practice of StatisticsStatisticsISBN:9781319013387Author:David S. Moore, George P. McCabe, Bruce A. CraigPublisher:W. H. Freeman
MATLAB: An Introduction with Applications
Statistics
ISBN:9781119256830
Author:Amos Gilat
Publisher:John Wiley & Sons Inc
Probability and Statistics for Engineering and th...
Statistics
ISBN:9781305251809
Author:Jay L. Devore
Publisher:Cengage Learning
Statistics for The Behavioral Sciences (MindTap C...
Statistics
ISBN:9781305504912
Author:Frederick J Gravetter, Larry B. Wallnau
Publisher:Cengage Learning
Elementary Statistics: Picturing the World (7th E...
Statistics
ISBN:9780134683416
Author:Ron Larson, Betsy Farber
Publisher:PEARSON
The Basic Practice of Statistics
Statistics
ISBN:9781319042578
Author:David S. Moore, William I. Notz, Michael A. Fligner
Publisher:W. H. Freeman
Introduction to the Practice of Statistics
Statistics
ISBN:9781319013387
Author:David S. Moore, George P. McCabe, Bruce A. Craig
Publisher:W. H. Freeman