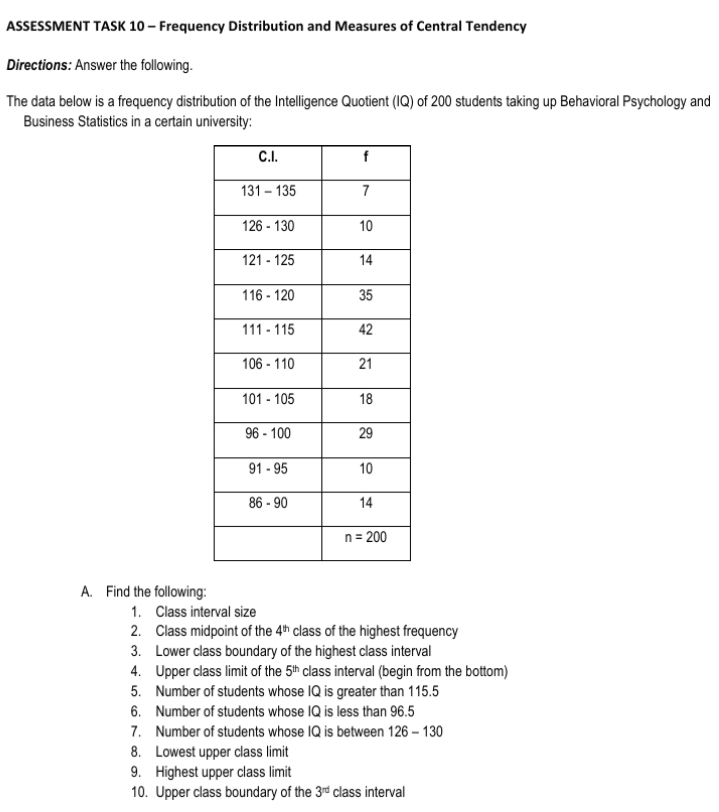
The data below is a frequency distribution of the Intelligence Quotient (IQ) of 200 students taking up Behavioral Psychology and Business Statistics in a certain university: C.I. 131 – 135 7 126 - 130 10 121 - 125 14 116 - 120 35 111 - 115 42 106 - 110 21 101 - 105 18 96 - 100 29 91 - 95 10 86 - 90 14 n= 200 A. Find the following: 1. Class interval size 2. Class midpoint of the 4th class of the highest frequency 3. Lower class boundary of the highest class interval 4. Upper class limit of the 5th class interval (begin from the bottom) 5. Number of students whose IQ is greater than 115.5 6. Number of students whose IQ is less than 96.5 7. Number of students whose IQ is between 126 – 130 8. Lowest upper class limit 9. Highest upper class limit 10. Upper class boundary of the 3d class interval


Inverse Normal Distribution
The method used for finding the corresponding z-critical value in a normal distribution using the known probability is said to be an inverse normal distribution. The inverse normal distribution is a continuous probability distribution with a family of two parameters.
Mean, Median, Mode
It is a descriptive summary of a data set. It can be defined by using some of the measures. The central tendencies do not provide information regarding individual data from the dataset. However, they give a summary of the data set. The central tendency or measure of central tendency is a central or typical value for a probability distribution.
Z-Scores
A z-score is a unit of measurement used in statistics to describe the position of a raw score in terms of its distance from the mean, measured with reference to standard deviation from the mean. Z-scores are useful in statistics because they allow comparison between two scores that belong to different normal distributions.


Trending now
This is a popular solution!

Step by step
Solved in 3 steps


