The following data give the time (in minutes) taken to commute from home to work for nurses. 10 50 65 33 48 11 23 37 26 26 32 17 7 13 19 29 43 21 22 1. Construct a frequency distribution table with 6 class intervals where the first class interval starts with 5. CLASS INTERVAL CLASS BOUNDARY CLASS MARK FREAQUENCY 2. Draw the frequency histogram of the distribution
The following data give the time (in minutes) taken to commute from home to work for nurses. 10 50 65 33 48 11 23 37 26 26 32 17 7 13 19 29 43 21 22 1. Construct a frequency distribution table with 6 class intervals where the first class interval starts with 5. CLASS INTERVAL CLASS BOUNDARY CLASS MARK FREAQUENCY 2. Draw the frequency histogram of the distribution

Glencoe Algebra 1, Student Edition, 9780079039897, 0079039898, 2018
18th Edition
ISBN:9780079039897
Author:Carter
Publisher:Carter
Chapter10: Statistics
Section10.4: Distributions Of Data
Problem 19PFA

Related questions
Question
Hello. I need help with this statistic problem. Please include solutions in a piece of paper for me to understand. Thank you so much!
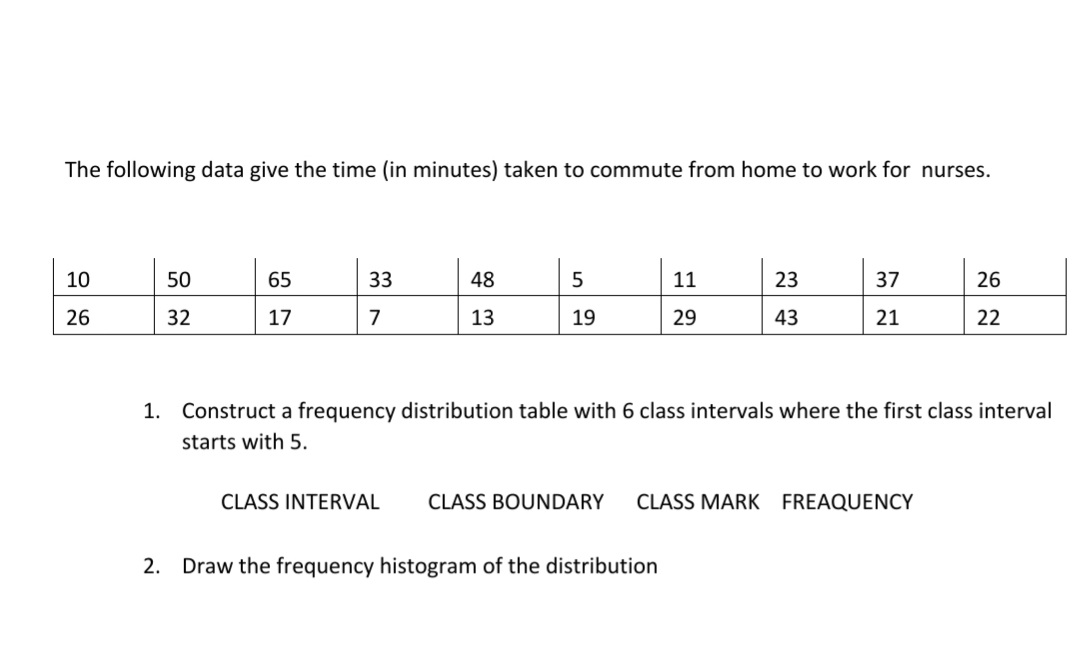
Transcribed Image Text:The following data give the time (in minutes) taken to commute from home to work for nurses.
10
50
65
33
48
5
11
23
37
26
26
32
17
7
13
19
29
43
21
22
1. Construct a frequency distribution table with 6 class intervals where the first class interval
starts with 5.
CLASS INTERVAL
CLASS BOUNDARY
CLASS MARK FREAQUENCY
2. Draw the frequency histogram of the distribution
Expert Solution
This question has been solved!
Explore an expertly crafted, step-by-step solution for a thorough understanding of key concepts.

This is a popular solution!

Trending now
This is a popular solution!

Step by step
Solved in 3 steps with 1 images

Recommended textbooks for you
Glencoe Algebra 1, Student Edition, 9780079039897…
Algebra
ISBN:
9780079039897
Author:
Carter
Publisher:
McGraw Hill

Mathematics For Machine Technology
Advanced Math
ISBN:
9781337798310
Author:
Peterson, John.
Publisher:
Cengage Learning,
Glencoe Algebra 1, Student Edition, 9780079039897…
Algebra
ISBN:
9780079039897
Author:
Carter
Publisher:
McGraw Hill
Mathematics For Machine Technology
Advanced Math
ISBN:
9781337798310
Author:
Peterson, John.
Publisher:
Cengage Learning,