The data from car crash tests for four different vehicle size categories (Small, Midsize, Large, and SUV) with measured amounts of left leg femur force (kN) results in the following Minitab display. Using a 0.05 significance level, test the claim that the four vehicle size categories have the same mean force on the femur of the left leg. Does size of the car appear to have an effect on the force on the left femur in crash tests? Analysis of Variance Adj SS Source DF Adj MS 0.2487 F-Value P-Value 0.7461 20.5296 21.2757 Size 3 0.63 0.599 Error 52 0.3948 Total 55 Determine the null hypothesis. Ho: At least one of the means is different from the others All of the means are different H1 < H2
The data from car crash tests for four different vehicle size categories (Small, Midsize, Large, and SUV) with measured amounts of left leg femur force (kN) results in the following Minitab display. Using a 0.05 significance level, test the claim that the four vehicle size categories have the same mean force on the femur of the left leg. Does size of the car appear to have an effect on the force on the left femur in crash tests? Analysis of Variance Adj SS Source DF Adj MS 0.2487 F-Value P-Value 0.7461 20.5296 21.2757 Size 3 0.63 0.599 Error 52 0.3948 Total 55 Determine the null hypothesis. Ho: At least one of the means is different from the others All of the means are different H1 < H2

Glencoe Algebra 1, Student Edition, 9780079039897, 0079039898, 2018
18th Edition
ISBN:9780079039897
Author:Carter
Publisher:Carter
Chapter10: Statistics
Section10.3: Measures Of Spread
Problem 1GP

Related questions
Question
Also P value, T stat, confidence Interval and Conclusion
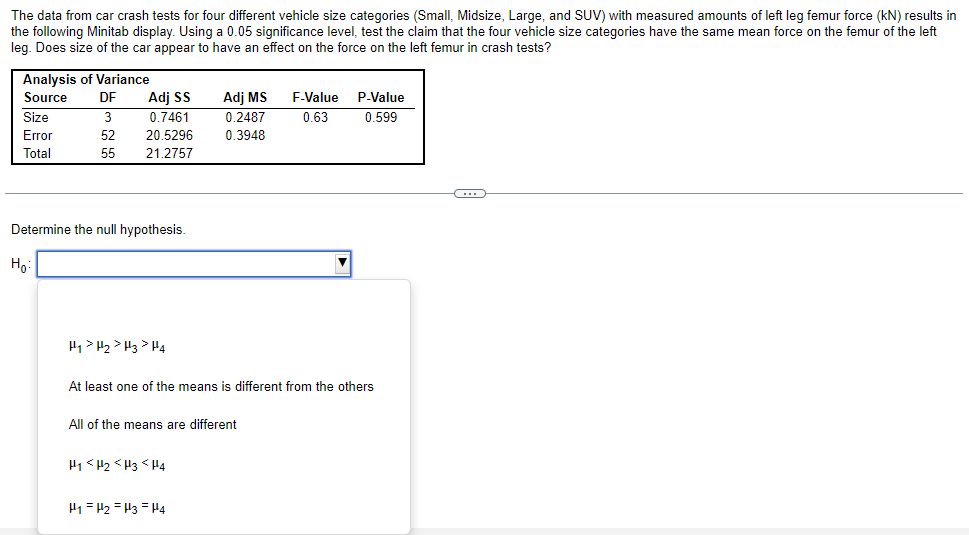
Transcribed Image Text:The data from car crash tests for four different vehicle size categories (Small, Midsize, Large, and SUV) with measured amounts of left leg femur force (kN) results in
the following Minitab display. Using a 0.05 significance level, test the claim that the four vehicle size categories have the same mean force on the femur of the left
leg. Does size of the car appear to have an effect on the force on the left femur in crash tests?
Analysis of Variance
Adj SS
Source
DF
Adj MS
0.2487
F-Value
P-Value
0.7461
20.5296
21.2757
Size
3
0.63
0.599
Error
52
0.3948
Total
55
Determine the null hypothesis.
Ho:
At least one of the means is different from the others
All of the means are different
H1 < H2 <H3 < H4
H1 = H2 = H3 = H4
Expert Solution
This question has been solved!
Explore an expertly crafted, step-by-step solution for a thorough understanding of key concepts.

This is a popular solution!

Trending now
This is a popular solution!

Step by step
Solved in 2 steps with 2 images

Recommended textbooks for you
Glencoe Algebra 1, Student Edition, 9780079039897…
Algebra
ISBN:
9780079039897
Author:
Carter
Publisher:
McGraw Hill
Glencoe Algebra 1, Student Edition, 9780079039897…
Algebra
ISBN:
9780079039897
Author:
Carter
Publisher:
McGraw Hill