1. List all of the characteristics of the Standard Normal Distribution.

MATLAB: An Introduction with Applications
6th Edition
ISBN:9781119256830
Author:Amos Gilat
Publisher:Amos Gilat
Chapter1: Starting With Matlab
Section: Chapter Questions
Problem 1P

Related questions
Question
Transcribed Image Text:10:46 1
3134_M9L4_practice...
AFDA
9.4 Practice
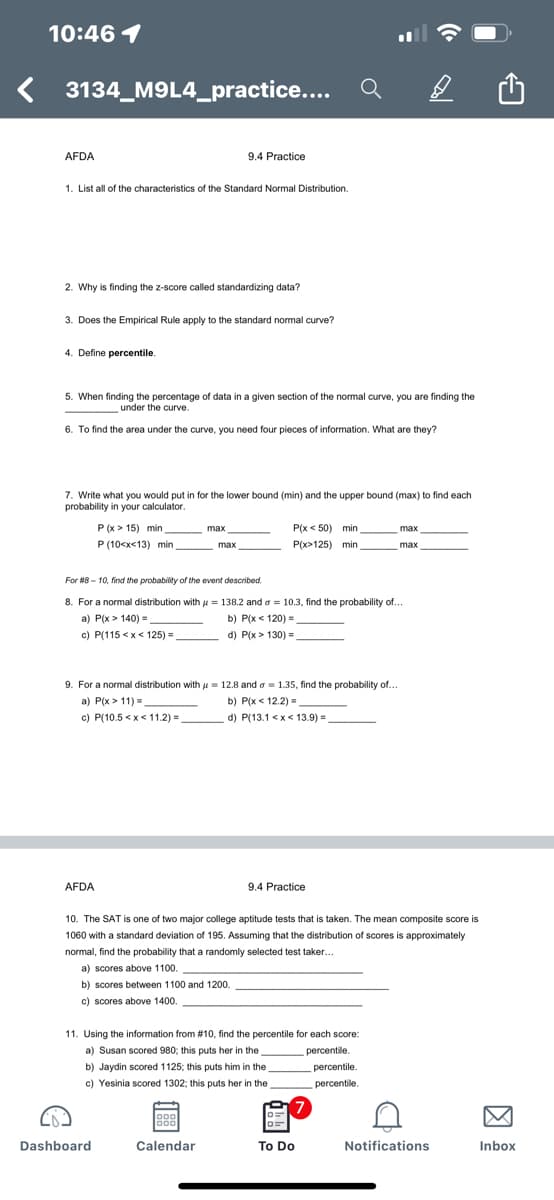
1. List all of the characteristics of the Standard Normal Distribution.
2. Why is finding the z-score called standardizing data?
3. Does the Empirical Rule apply to the standard nomal curve?
4. Define percentile.
5. When finding the percentage of data in a given section of the normal curve, you are finding the
under the curve.
6. To find the area under the curve, you need four pieces of information. What are they?
7. Write what you would put in for the lower bound (min) and the upper bound (max) to find each
probability in your calculator.
P (x > 15) min
P (10<x<13) min
P(x < 50) min
P(x>125) min
max
max
max
max
For #8 - 10, find the probability of the event described.
8. For a normal distribution with u = 138.2 and a = 10.3, find the probability of...
a) P(x > 140) =
b) P(x < 120) =
c) P(115 <x< 125) =
d) P(x > 130) =
9. For a normal distribution with u = 12.8 and o = 1.35, find the probability of...
a) P(x > 11) =
c) P(10.5 <x< 11.2) =
b) P(x < 12.2) =
d) P(13.1 <x< 13.9)=
.
AFDA
9.4 Practice
10. The SAT is one of two major college aptitude tests that is taken. The mean composite score is
1060 with a standard deviation of 195. Assuming that the distribution of scores is approximately
normal, find the probability that a randomly selected test taker.
a) scores above 1100.
b) scores between 1100 and 1200.
c) scores above 1400.
11. Using the information from #10, find the percentile for each score:
a) Susan scored 980; this puts her in the
percentile.
b) Jaydin scored 1125; this puts him in the
percentile.
c) Yesinia scored 1302; this puts her in the
percentile.
Dashboard
Calendar
To Do
Notifications
Inbox
因
Expert Solution
This question has been solved!
Explore an expertly crafted, step-by-step solution for a thorough understanding of key concepts.

Step by step
Solved in 3 steps with 1 images

Recommended textbooks for you
MATLAB: An Introduction with Applications
Statistics
ISBN:
9781119256830
Author:
Amos Gilat
Publisher:
John Wiley & Sons Inc

Probability and Statistics for Engineering and th…
Statistics
ISBN:
9781305251809
Author:
Jay L. Devore
Publisher:
Cengage Learning

Statistics for The Behavioral Sciences (MindTap C…
Statistics
ISBN:
9781305504912
Author:
Frederick J Gravetter, Larry B. Wallnau
Publisher:
Cengage Learning
MATLAB: An Introduction with Applications
Statistics
ISBN:
9781119256830
Author:
Amos Gilat
Publisher:
John Wiley & Sons Inc
Probability and Statistics for Engineering and th…
Statistics
ISBN:
9781305251809
Author:
Jay L. Devore
Publisher:
Cengage Learning
Statistics for The Behavioral Sciences (MindTap C…
Statistics
ISBN:
9781305504912
Author:
Frederick J Gravetter, Larry B. Wallnau
Publisher:
Cengage Learning

Elementary Statistics: Picturing the World (7th E…
Statistics
ISBN:
9780134683416
Author:
Ron Larson, Betsy Farber
Publisher:
PEARSON

The Basic Practice of Statistics
Statistics
ISBN:
9781319042578
Author:
David S. Moore, William I. Notz, Michael A. Fligner
Publisher:
W. H. Freeman

Introduction to the Practice of Statistics
Statistics
ISBN:
9781319013387
Author:
David S. Moore, George P. McCabe, Bruce A. Craig
Publisher:
W. H. Freeman