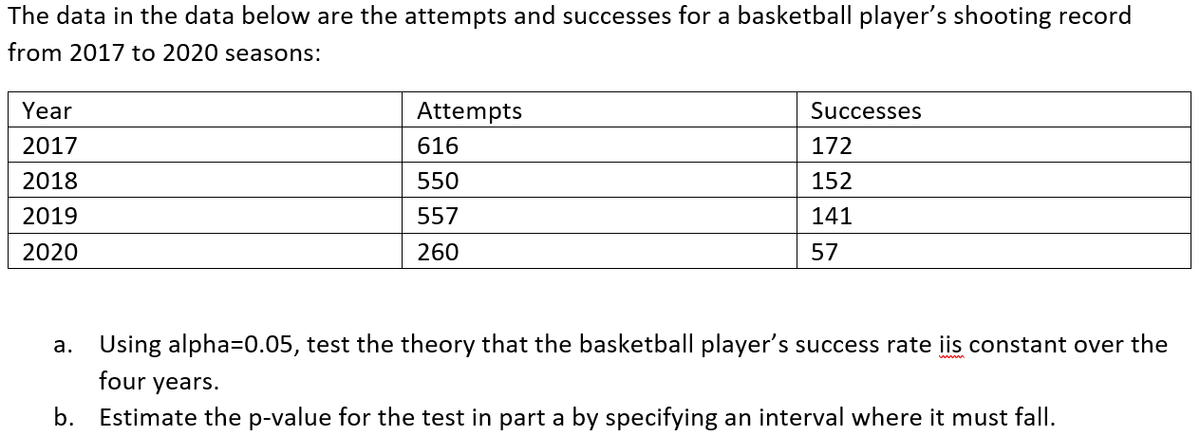
The data in the data below are the attempts and successes for a basketball player's shooting record from 2017 to 2020 seasons: Year Attempts Successes 2017 616 172 2018 550 152 2019 557 141 2020 260 57 a. Using alpha=0.05, test the theory that the basketball player's success rate iis constant over the four years. b. Estimate the p-value for the test in part a by specifying an interval where it must fall.


Q: The following regression output is for predicting the heart weight (in g) of cats from their body…
A: Given, R2=64.66%=0.6466 Coefficient of determination that is R square is the square of correlation…
Q: The table below shows the average stopping distance D, in feet, for a car on dry pavement versus the…
A: Change the Stopping distance to miles and us the value of D as y and S as x in the power function…
Q: xample: From the following data, find the following: 1- Find the equation with the explanation 2-…
A: In the given case we are provided with three columns of data from which it can be assumed that the…
Q: Smitley and Davis studied the changes in gypsy moth egg mass density over one generation as a…
A: A. Steps to construct scatter plot in Excel: Enter the data for x and y in Excel sheet Select the…
Q: Based on the data shown below, calculate the regression line (each value to two decimal places) y =…
A: Regression Equation: When we want to predict the value of one variable, say y, from the given value…
Q: Obtain the regression equation of Y on X for the following distribution. f (x, y) (1 + x)* exp (-y/1…
A: Answer: For the given data,
Q: The haemoglobin level in g/dL for 14 pregnant women in Basra Maternity Teaching Hospital for the…
A: For the central location and dispersion here we calculate the mean and standard deviation. Mean: The…
Q: The following table shows the number of full-time faculty that WVU has on staff throughout the…
A:
Q: The following data show the height h, in inches, and weight w, in pounds, of an average adult male.…
A:
Q: An artide in the ACI Materials Journal (Vol. 84, 1987, pp. 213-216) describes several experiments…
A: From the information, observe that the article in the ACI material journal describes several…
Q: An artide in the ACI Materials Journal (Vol. 84, 1987, pp. 213-216) describes several experiments…
A: given.data
Q: Kevin tested the germination rate of wheat under dark and light conditions and collected the…
A: ∑xi = Sum of all given observations, ∑x1 = Sum of all observations of the light conditions column.…
Q: The following data show the height h, in inches, and weight w, in pounds, of an average adult male.…
A: Let the power model for weight versus height be; w=ahbBy applying logarithm we can transfrom the…
Q: The following variables X and Y are both ratio scores: Participant 3 21 4 8. 4. 1 6. 8. 5. 21 7. 4…
A: Since you have asked multiple parts, I am submitting the first 3 ques as per Bartleby guidelines.…
Q: An experiment was conducted to determine if the weight of an animal can be predicted after a given…
A: In the given dataset, the Final weight of the animal is the response variable and the amount of feed…
Q: The following table shows the average life expectancy, in years, of a child born in the given year.†…
A: Step-by-step procedure to obtain the regression equation using MINITAB:Choose Stat > Regression…
Q: A sample of X and Y scores is taken, and a regression line is used to predict Y from X. If SSY' =…
A: Given information- We have given sample of X and Y scores. We have to predict Y from X using…
Q: Find the regression coefficient of y on x from the following regression equations. 5x 22 +y 64 x 24+…
A:
Q: The output below estimates the following regression Treat; = Bo + B1 · Female; + e; Based on the…
A: As the regression coefficient corresponding to female is 0.0051549 which much lower. Also from P…
Q: Brenda collected this data from an experiment: Hours of Sunlight (t) Height in Inches (h) 0.04 O…
A: We have to find the correct choice.
Q: Is the magnitude of an earthquake related to the depth below the surface at which the quake occurs?…
A: a) Step-by-step software procedure to draw scatter plot using Excel software is given below:…
Q: Observations on the yield of a chemical reaction taken at various temperatures were recorded as…
A: Given: x y 150 75.4 150 81.2 200 85.5 250 89 250 90.5 300 96.7 150 77.7 200 84.4…
Q: Use the data in the table to Salary (in Pesos) No. of Employees (f) compute the following…
A: A decile is a numerical method of dividing a set of ranked data into ten equal-sized subsections.A…
Q: The regression output from a model for predicting the heart weight (in g) of cats from their body…
A: (a) The null and alternative hypothesis is, The level of significance is, The sample size is, n =…
Q: The arm span and foot length were both measured (in centimeters) for each of 20 students in a…
A: Given data:
Q: Based on the data shown below, calculate the regression line (each value to two decimal places) y =…
A: From given data, X Y X*Y X*X 1 7.33 7.33 1 2 6.82 13.64 4 3 6.41 19.23 9 4 4.1 16.4 16…
Q: A scientist collected the following data on the speed, in centimeters per second, at which ants ran…
A: Hey, since there are multiple subparts posted, we will answer first three subparts. If you want any…
Q: A series of x and y data in the table below, is to be fitted by Where c is the mean value of x. Fit…
A:
Q: Consider the setting of Exercise 1. The residuals corresponding to the LSQ line, HR = 133.72 – 280.8…
A: Note: Hi there! Thank you for posting the question. As you have posted multiple questions, as per…
Q: The average daily cost of living in dollars (x) and the average wage in dollars (y) in 12 regions of…
A: Note: As per the guidelines, we are supposed to solve only first three subparts. Please repost the…
Q: t6. In a field experiment, the earth worm densities obsérved in đifferent sites with varying soil…
A: Introduction - Correlation - Correlation is a statistical measure that describes the size and…
Q: Based on the data shown below, calculate the regression line (each value to two decimal places) y =…
A: The following data has been given: x y 3 18.66 4 20.18 5 21.4 6 22.22 7 21.44 8 23.56…
Q: The following data represent the growth of a population of fruit flies over a 6-week period. Test…
A: Given : Following data represents the growth of a population of fruit flies over a 6 - week period.…
Q: For Exercise 10 test the claim that they are from a population having a mean less than 4.00 Mbps.…
A: The t test are used to measure the mean significance between the two variables. It can be tested for…
Q: QI/ Experimental data for the heat capacity in cal/(g.mol)(°C) as a function of temperature is given…
A:
Q: Find the correlation coefficient and report it accurate to three decimal places. r = Based on the…
A:
Q: As concrete cures, it gains strength. The following data represent the 7-day and 28-day strength…
A:
Q: he table below shows how far a person driving in their car was able to o over different intervals of…
A: Solution From table Two points -> (0,0), (1.2,26)
Q: The arm span and foot length were both measured (in centimeters) for each of 20 students in a…
A:
Q: Consider the following regression estimates (FN8) Source df MS Nunber of obs 500 F(2, 497) 2…
A: Solution: The estimated regression equation is Income ^= 302.975-37.5719 Female +18.79374 hours
Q: Based on the data shown below, calculate the regression line (each value to at least two decimal…
A: Given: First enter this data into ExcelNow,
Q: The following table gives the regression results of consumption behaviour between female and male.…
A: Note: Hey there! Thank you for the question. As you have posted multiple sub-parts, we have helped…
Q: 3. A study of beer consumption using the annual data from 1980 -2001 produced the following…
A: Since you have posted a question with multiple subparts, we will solve first 3 sub-parts for you…
Q: The table below shows the value, V, of an investment (in dollars) n years after 1985. n 1 3 7 12 14…
A: we shall use excel to determine the equation. The linear regression equation is of form y=β0+β1x…
Q: For this exercise, round all regression parameters to three decimal places. The following table…
A: Given, t=years Since 1950 P=Patents 0 4718 10 2543 20 3214 30 3949 40 8024 50 17413…
Q: Is there a significant relationship between an individual's income and the set of variables, age,…
A: Given is a linear regression analysis where the dependent variable is individual's income and…
Q: Use regression to find a quartic model for the given data set. Round the regression parameters to…
A: An equation of the form y=a+bx+cx2 is called a quadratic function. So we have to find the…
Q: Use the following partial Stata Regression output to answer this question: Source ss df MS Model…
A: Obtain the value of r square. The value of r square is obtained below as follows: From the…
Q: The data presented in the following table give the tensile strength in psi (y) of paper as a…
A:

Step by step
Solved in 3 steps

- The data in the accompanying table are from a paper. Suppose that each person in a random sample of 49 male students and in a random sample of 88 female students at a particular college was classified according to gender and whether they usually or rarely eat three meals a day. Find the test statistic and P-value. (Use SALT. Round your test statistic to three decimal places and your P-value to four decimal places.) Usually Eat3 Meals a Day Rarely Eat3 Meals a Day Male 26 23 Female 35 53A fisheries biologist collected a random sample of fish from a lake and conducted a chi-square goodness-of-fit test to see if the distribution of fish changed over time. The table below shows the distribution of fish that were put into the lake when it was originally stocked. Fish Type Trout Bass Perch Sunfish Catfish Percent 25% 25% 20% 15% 15% The biologist found evidence to reject the null hypothesis in favor of the alternative hypothesis. Which of the following represents the alternative hypothesis of the test?A group of six, obese adult men had their weights recorded both before and 10 months after having a diet treatment to help manage their weight. Observe the information presented in the table below: The weights of six obese adult men both before and 10-months after having a diet treatment Before Diet Treatment After Diet Treatment 250 240 225 215 220 198 311 300 326 298 205 205 Test at α = 0.05 the hypothesis that for the group, there was a statistically significant average decrease in weight from before diet treatment to 10 months after. Hint: This is hypothesis testing for paired samples. Here, you will use a paired t test.
- The data in the accompanying table are from a paper. Suppose that each person in a random sample of 49 male students and in a random sample of 93 female students at a particular college was classified according to gender and whether they usually or rarely eat three meals a day. Usually Eat3 Meals a Day Rarely Eat3 Meals a DayMale 25 24Female 38 55 Find the test statistic and P-value. (Use SALT. Round your test statistic to three decimal places and your P-value to four decimal places.) X2= P-value=Researchers interested in lead exposure due to car exhaust sampled the blood of 52 police officers subjected to constant inhalation of automobile exhaust fumes while working traffic enforcement in a primarily urban environment. The blood samples of these officers had an average lead concentration of 124.32 µg/l and a SD of 37.74 µg/l; a previous study of individuals from a nearby suburb, with no history of exposure, found an average blood level concentration of 35 µg/l. Test the hypothesis that the downtown police officers have a higher lead exposure than the group in the previous study. Interpret your results in context. Based on your preceding result, without performing a calculation, would a 99% confidence interval for the average blood concentration level of police officers contain 35 µg/l? Based on your preceding result, without performing a calculation, would a 99% confidence interval for this difference contain 0? Explain why or why not.Use the following data to determine if drug B produces higher creatinine levels than drug A, assume the data is normally distributed. Creatinine levels (µmol/L) Drug A Drug B 48.2 52.3 54.6 57.4 58.3 55.6 47.8 53.2 51.4 61.3 52.0 58.0 55.2 59.8 49.1 54.8 49.9 52.6 Write out the null and alternative hypothesis in *words and symbols*. What is the hypothesis in words? Determine the critical value (use a significance level of 0.05) Calculate the test statistic, and determine if the results are significant or not. How did you calculate the standard deviations? Please provide a complete outline of calculations
- The following data are from a random sample of 10 students who participated in a study undertaken to investigate the effect of sleep time (measured in average number of hours of sleep per night) on GPA (grade point average, measured on a 4-point scale). Student Sleep time GPA 1 7 3.28 2 9 3.16 3 8 3.75 4 6 2.50 5 4 2.45 6 8 2.91 7 7 3.53 8 6 3.02 9 3 2.30 10 8 3.48 a. Find the equation between GPA (y) as function of sleep time (x). b. What is the estimated GPA of a student who averages 5 hours of sleep per night? c. What is the coefficient of determination? *(no use EXCEL)As a bonus assignment a former student checked if your professor gave a statisticallysignificant difference in grades between his male and female students. She based herstudy based on grades assigned in intermediate Econ courses (Econ 303, 305 and 317)and her sample included nm = 485 male students and nf = 264 female students. Theaverage grades received were xm = 84.6 and xf = 85.8 The population standad deviation were σ m = 12.0 and σ f = 11.4 8. From the same extra-credit study as in question 7 see above, this former student found that the proportion of female students in principle courses (Econ 203, 205) was ?̅? = 0.380, while the proportion of female students in intermediate courses (Econ 303, 305, 317) was ?̅? = 0.352. The principle courses sample size was np = 782, while the intermediate courses sample size was ni = 749. Test the hypothesis that female students are less in intermediate courses using a 90% confidence level and the p-value approach.An experiment was conducted to see the effectiveness of two antidotes to three different doses of a toxin. The antidote was given to a different sample of participants five minutes after the toxin. Thirty minutes later the response was measured as the concentration in the blood. What can the researchers conclude with α = 0.05? Dose Antidote 5 10 15 1 0.61.11.1 7.21.52.4 3.14.15.9 2 1.11.21.1 1.71.31.5 2.13.12.1 A) Obtain/compute the appropriate values to make a decision about H0.Antidote: critical value = test statistic = Decision: Dose: critical value = test statistic = Decision: Interaction: critical value = test statistic = Decision: B) Compute the corresponding effect size(s) and indicate magnitude(s).Antidote: η2 = Dose: η2 = Interaction: η2 =
- For a special pre–New Year’s Eve show, a radio station personality has invited a small panel of prominent local citizens to help demonstrate to listeners the adverse effect of alcohol on reaction time. The reaction times (in seconds) before and after consuming four drinks are in data below. At the 0.005 level, has the program host made his point? Identify and interpret the p-value for the test. Data: Subject Before After 1 0.32 0.39 2 0.39 0.44 3 0.36 0.49 4 0.41 0.53 5 0.37 0.46 6 0.42 0.52 7 0.41 0.52 8 0.43 0.46 9 0.39 0.55 10 0.41 0.52 11 0.35 0.45 12 0.42 0.41 13 0.32 0.54 14 0.39 0.46 15 0.41 0.53 16 0.33 0.54 17 0.43 0.46 18 0.42 0.43 19 0.41 0.52 20 0.35 0.52 21 0.39 0.41 22 0.39 0.44 23 0.32 0.50 24 0.33 0.53 25 0.31 0.45 26 0.35 0.45 27 0.31 0.45 28 0.32 0.48 29 0.38 0.54 30 0.37 0.46 31 0.39 0.49 32 0.30 0.51 33 0.40 0.49 34 0.41 0.50 35 0.41 0.53 36 0.35 0.47 37 0.37 0.51 38 0.41 0.46The below time series gives the indices of Industrial Production in U.S for 10 consecutive years. Year IP 1 79.62 2 86.54 3 88.14 4 89.23 5 93.45 6 97.4 7 99.34 8 96.98 9 100.22 10 103.56 Construct a time series plot. What type of pattern exists in the data? Use simple linear regression analysis to find the parameters for the line that minimizes MSE for this time series. c. What is the forecast for t = 11?A snack food manufacturer estimates that the variance of the number of grams of carbohydrates in servings of its tortilla chips is 1.33. A dietician is asked to test this claim and finds that a random sample of 24 servings has a variance of 1.37. At α=0.01, is there enough evidence to reject the manufacturer's claim? Assume the population is normally distributed. Complete parts (a) through (e) below. (a) Write the claim mathematically and identify H0 and Ha. A. H0: σ2≤1.33 (Claim) Ha: σ2>1.33 B. H0: σ2≠1.33 Ha: σ2=1.33 (Claim) C. H0: σ2≥1.33 Ha: σ2<1.33 (Claim) D. H0: σ2=1.33 (Claim) Ha: σ2≠1.33 (b) Find the critical value(s) and identify the rejection region(s). The critical value(s) is(are) enter your response here. (Round to two decimal places as needed. Use a comma to separate answers as needed.) Choose the correct statement below and fill in the corresponding answer boxes. A. The…
