You wish to determine if there is a positive linear correlation between the age of a driver and the number of driver deaths. The following table represents the age of a driver and the number of driver deaths per 100,000. Use a significance level of 0.05 and round all values to 4 decimal places. Driver Age Number of Driver Deaths per 100,000 64 32 55 30 72 36 34 30 31 18 16 29 21 22 32 18 46 24 46 31 Ho: ρ = 0 Ha: ρ > 0 Find the Linear Correlation Coefficient r = Find the p-value p-value = The p-value is Greater than αα Less than (or equal to) αα The p-value leads to a decision to Do Not Reject Ho Reject Ho Accept Ho The conclusion is There is a significant linear correlation between driver age and number of driver deaths. There is a significant negative linear correlation between driver age and number of driver deaths. There is a significant positive linear correlation between driver age and number of driver deaths. There is insufficient evidence to make a conclusion about the linear correlation between driver age and number of driver deaths.


Correlation
Correlation defines a relationship between two independent variables. It tells the degree to which variables move in relation to each other. When two sets of data are related to each other, there is a correlation between them.
Linear Correlation
A correlation is used to determine the relationships between numerical and categorical variables. In other words, it is an indicator of how things are connected to one another. The correlation analysis is the study of how variables are related.
Regression Analysis
Regression analysis is a statistical method in which it estimates the relationship between a dependent variable and one or more independent variable. In simple terms dependent variable is called as outcome variable and independent variable is called as predictors. Regression analysis is one of the methods to find the trends in data. The independent variable used in Regression analysis is named Predictor variable. It offers data of an associated dependent variable regarding a particular outcome.
You wish to determine if there is a
| Driver Age | Number of Driver Deaths per 100,000 |
|---|---|
| 64 | 32 |
| 55 | 30 |
| 72 | 36 |
| 34 | 30 |
| 31 | 18 |
| 16 | 29 |
| 21 | 22 |
| 32 | 18 |
| 46 | 24 |
| 46 | 31 |
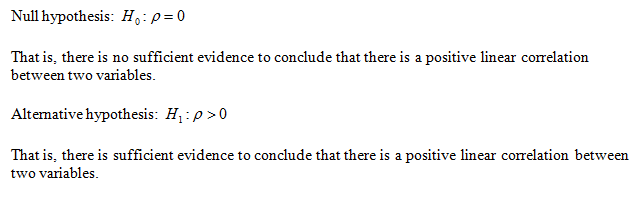
Ho: ρ = 0
Ha: ρ > 0
Find the Linear
r =
Find the p-value
p-value =
The p-value is
- Greater than αα
- Less than (or equal to) αα
The p-value leads to a decision to
- Do Not Reject Ho
- Reject Ho
- Accept Ho
The conclusion is
- There is a significant linear correlation between driver age and number of driver deaths.
- There is a significant
negative linear correlation between driver age and number of driver deaths. - There is a significant positive linear correlation between driver age and number of driver deaths.
- There is insufficient evidence to make a conclusion about the linear correlation between driver age and number of driver deaths.
State the hypotheses.
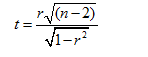
Obtain the value of the test statistic.
The formula of the test statistic is,
Use EXCEL to obtain the value correlation coefficient r:
EXCEL procedure:
- Go to EXCEL
- Go to Data>Data Analysis.
- Choose Correlation.
- Enter the range as $A$1:$B$11.
- Check the option Labels in First row.
- Click OK.
EXCEL output:
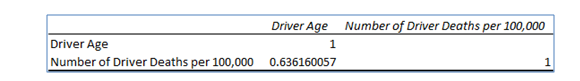
From EXCEL output, the value of the correlation is 0.6362.
Thus, the correlation value is 0.6362.
It is clear that, the value correlation coefficient r is 0.6362 with the sample of 10.
The required value of test statistic is,
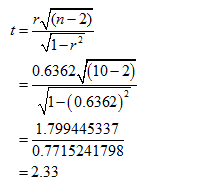
Thus, the value of the test statistic is 2.33
Obtain the degrees of freedom.
The degrees of freedom is obtained below:
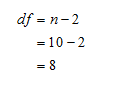
Thus, the degrees of freedom is 18.

Step by step
Solved in 3 steps with 6 images


