or questions 30-32, use the output below: Coefficientsa Standardized Unstandardized Coefficients Coefficients Model B Std. Error Beta t Sig. (Constant) 538 208 2.591 .010 Highest year of school -064 .011 -113 -5.763 .000 completed Respondents sex .161 .063 .048 2.581 .010 Number of brothers and .086 .011 .146 7.553 .000 sisters Size of place in 1000s -4.885E-5 .000 -.034 -1.833 .067 Age of respondent .031 .002 337 17.932 .000 BibleWordofGod 390 .071 107 5.510 _000 . Dependent Variable: Number of children 0. Which independent variables do NOT significantly predict the number of children and how id you decide? 1. As respondents have more education, do they have on average more or less children and how id you decide? 2. Which of the six independent variables is the single strongest predictor of the number of nildren a person has and how did you decide?
or questions 30-32, use the output below: Coefficientsa Standardized Unstandardized Coefficients Coefficients Model B Std. Error Beta t Sig. (Constant) 538 208 2.591 .010 Highest year of school -064 .011 -113 -5.763 .000 completed Respondents sex .161 .063 .048 2.581 .010 Number of brothers and .086 .011 .146 7.553 .000 sisters Size of place in 1000s -4.885E-5 .000 -.034 -1.833 .067 Age of respondent .031 .002 337 17.932 .000 BibleWordofGod 390 .071 107 5.510 _000 . Dependent Variable: Number of children 0. Which independent variables do NOT significantly predict the number of children and how id you decide? 1. As respondents have more education, do they have on average more or less children and how id you decide? 2. Which of the six independent variables is the single strongest predictor of the number of nildren a person has and how did you decide?

Linear Algebra: A Modern Introduction
4th Edition
ISBN:9781285463247
Author:David Poole
Publisher:David Poole
Chapter7: Distance And Approximation
Section7.3: Least Squares Approximation
Problem 31EQ

Related questions
Question
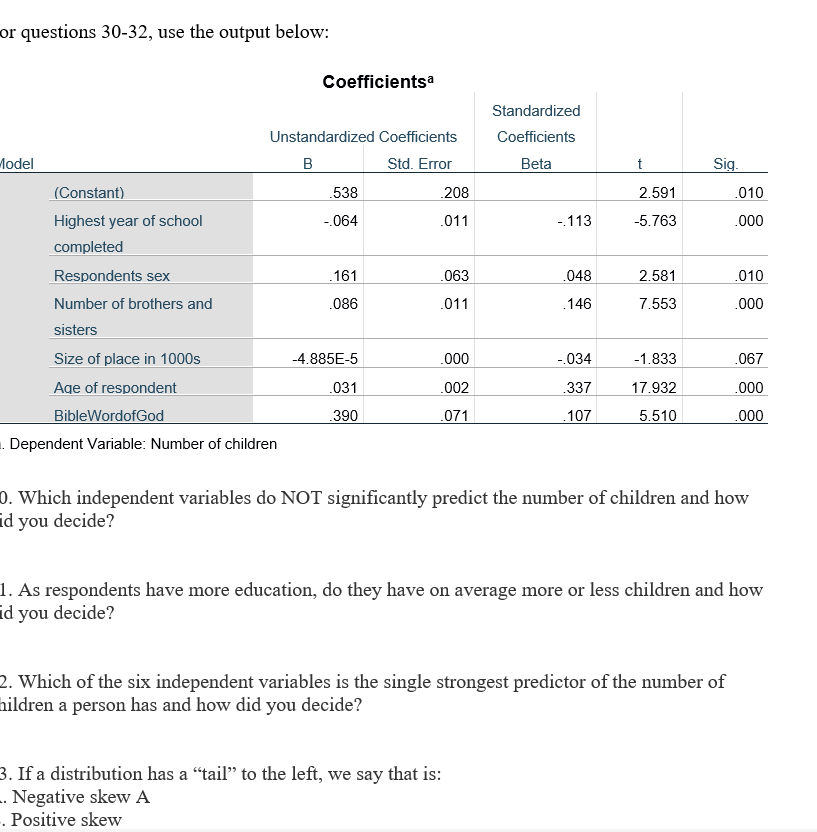
Transcribed Image Text:or questions 30-32, use the output below:
Coefficientsa
Standardized
Unstandardized Coefficients
Coefficients
Model
B
Std. Error
Beta
t
Sig.
(Constant)
.538
.208
2.591
.010
Highest year of school
-.064
.011
-113
-5.763
.000
completed
Respondents sex
.161
.063
.048
2.581
.010
Number of brothers and
.086
.011
.146
7.553
.000
sisters
Size of place in 1000s
-4.885E-5
.000
-.034
-1.833
.067
Age of respondent
.031
.002
.337
17.932
.000
BibleWordofGod
390
.071
.107
5.510
.000
. Dependent Variable: Number of children
0. Which independent variables do NOT significantly predict the number of children and how
id you decide?
1. As respondents have more education, do they have on average more or less children and how
id you decide?
2. Which of the six independent variables is the single strongest predictor of the number of
hildren a person has and how did you decide?
3. If a distribution has a “tail" to the left, we say that is:
-. Negative skew A
. Positive skew
Expert Solution
This question has been solved!
Explore an expertly crafted, step-by-step solution for a thorough understanding of key concepts.

Step by step
Solved in 4 steps

Recommended textbooks for you
Linear Algebra: A Modern Introduction
Algebra
ISBN:
9781285463247
Author:
David Poole
Publisher:
Cengage Learning
Linear Algebra: A Modern Introduction
Algebra
ISBN:
9781285463247
Author:
David Poole
Publisher:
Cengage Learning