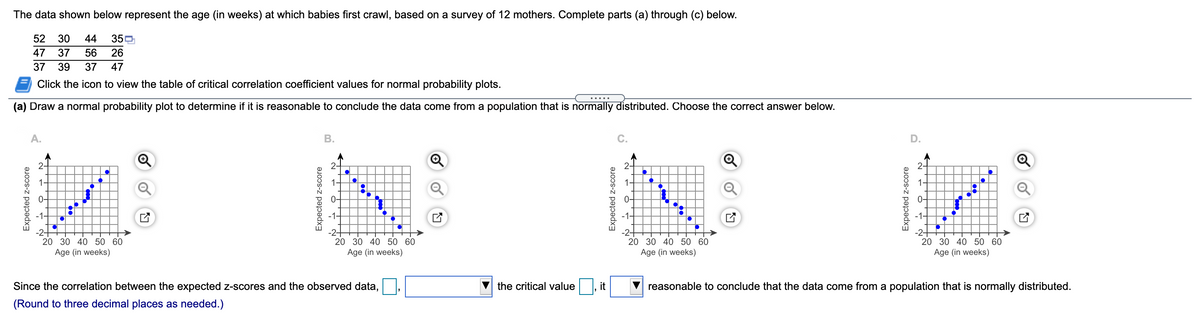
The data shown below represent the age (in weeks) at which babies first crawl, based on a survey of 12 mothers. Complete parts (a) through (c) below. 52 30 44 350 47 37 56 26 37 39 37 47 Click the icon to view the table of critical correlation coefficient values for normal probability plots. (a) Draw a normal probability plot to determine if it is reasonable to conclude the data come from a population that is normally distributed. Choose the correct answer below. B. 30 40 50 60 Age (in weeks) 20 30 40 50 60 20 30 40 50 60 Age (in weeks) 20 30 40 50 60 Age (in weeks) Age (in weeks) Since the correlation between the expected z-scores and the observed data, V the critical value, it V reasonable to conclude that the data come from a population that is normally distributed. (Round to three decimal places as needed.) aJ00-z popodx
The data shown below represent the age (in weeks) at which babies first crawl, based on a survey of 12 mothers. Complete parts (a) through (c) below. 52 30 44 350 47 37 56 26 37 39 37 47 Click the icon to view the table of critical correlation coefficient values for normal probability plots. (a) Draw a normal probability plot to determine if it is reasonable to conclude the data come from a population that is normally distributed. Choose the correct answer below. B. 30 40 50 60 Age (in weeks) 20 30 40 50 60 20 30 40 50 60 Age (in weeks) 20 30 40 50 60 Age (in weeks) Age (in weeks) Since the correlation between the expected z-scores and the observed data, V the critical value, it V reasonable to conclude that the data come from a population that is normally distributed. (Round to three decimal places as needed.) aJ00-z popodx

MATLAB: An Introduction with Applications
6th Edition
ISBN:9781119256830
Author:Amos Gilat
Publisher:Amos Gilat
Chapter1: Starting With Matlab
Section: Chapter Questions
Problem 1P

Related questions
Question
Question #4
Transcribed Image Text:The data shown below represent the age (in weeks) at which babies first crawl, based on a survey of 12 mothers. Complete parts (a) through (c) below.
52
30
44
350
47
37
56
26
37
39
37
47
Click the icon to view the table of critical correlation coefficient values for normal probability plots.
(a) Draw a normal probability plot to determine if it is reasonable to conclude the data come from a population that is normally distributed. Choose the correct answer below.
A.
В.
C.
D.
2-
2-
2-
1.
-1-
-2-
20 30 40 50 60
Age (in weeks)
-2+
20 30 40 50 60
20 30 40 50 60
20 30 40 50 60
Age (in weeks)
Age (in weeks)
Age (in weeks)
Since the correlation between the expected z-scores and the observed data,
the critical value
it
reasonable to conclude that the data come from a population that is normally distributed.
(Round to three decimal places as needed.)
Expected z-score
Expected z-score
B.
Expected z-score
Expected z-score
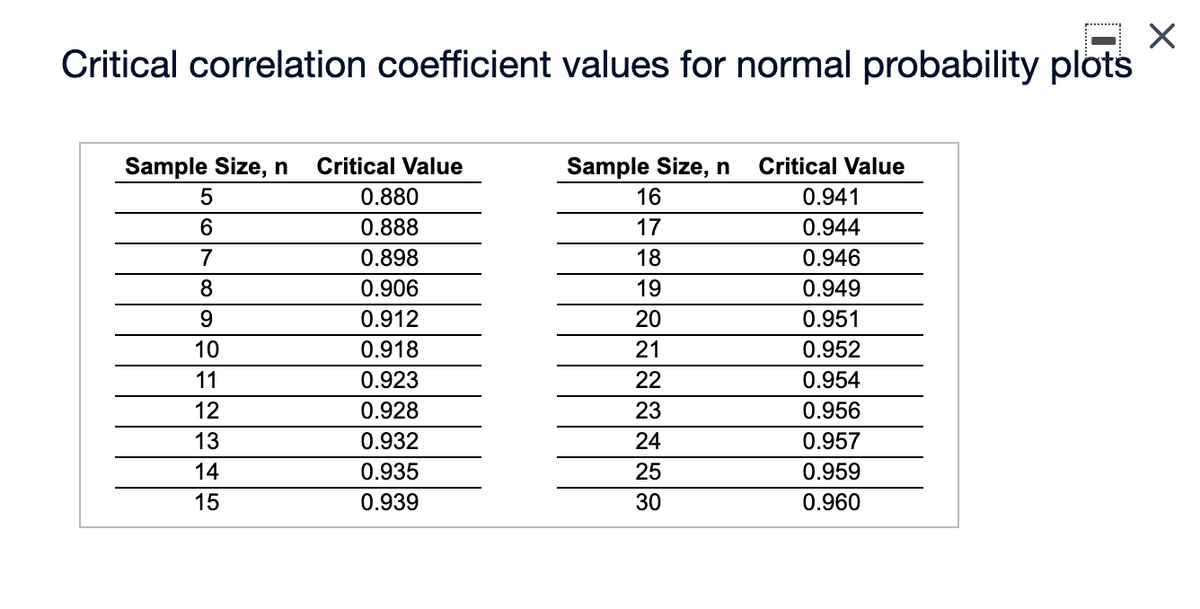
Transcribed Image Text:Critical correlation coefficient values for normal probability plots
Sample Size, n
Critical Value
Sample Size, n
Critical Value
0.880
16
0.941
6.
0.888
17
0.944
7
0.898
18
0.946
8
0.906
19
0.949
9.
0.912
20
0.951
10
0.918
21
0.952
11
0.923
22
0.954
12
0.928
23
0.956
13
0.932
24
0.957
14
0.935
25
0.959
15
0.939
30
0.960
Expert Solution
This question has been solved!
Explore an expertly crafted, step-by-step solution for a thorough understanding of key concepts.

This is a popular solution!

Trending now
This is a popular solution!

Step by step
Solved in 3 steps with 4 images

Recommended textbooks for you
MATLAB: An Introduction with Applications
Statistics
ISBN:
9781119256830
Author:
Amos Gilat
Publisher:
John Wiley & Sons Inc

Probability and Statistics for Engineering and th…
Statistics
ISBN:
9781305251809
Author:
Jay L. Devore
Publisher:
Cengage Learning

Statistics for The Behavioral Sciences (MindTap C…
Statistics
ISBN:
9781305504912
Author:
Frederick J Gravetter, Larry B. Wallnau
Publisher:
Cengage Learning
MATLAB: An Introduction with Applications
Statistics
ISBN:
9781119256830
Author:
Amos Gilat
Publisher:
John Wiley & Sons Inc
Probability and Statistics for Engineering and th…
Statistics
ISBN:
9781305251809
Author:
Jay L. Devore
Publisher:
Cengage Learning
Statistics for The Behavioral Sciences (MindTap C…
Statistics
ISBN:
9781305504912
Author:
Frederick J Gravetter, Larry B. Wallnau
Publisher:
Cengage Learning

Elementary Statistics: Picturing the World (7th E…
Statistics
ISBN:
9780134683416
Author:
Ron Larson, Betsy Farber
Publisher:
PEARSON

The Basic Practice of Statistics
Statistics
ISBN:
9781319042578
Author:
David S. Moore, William I. Notz, Michael A. Fligner
Publisher:
W. H. Freeman

Introduction to the Practice of Statistics
Statistics
ISBN:
9781319013387
Author:
David S. Moore, George P. McCabe, Bruce A. Craig
Publisher:
W. H. Freeman