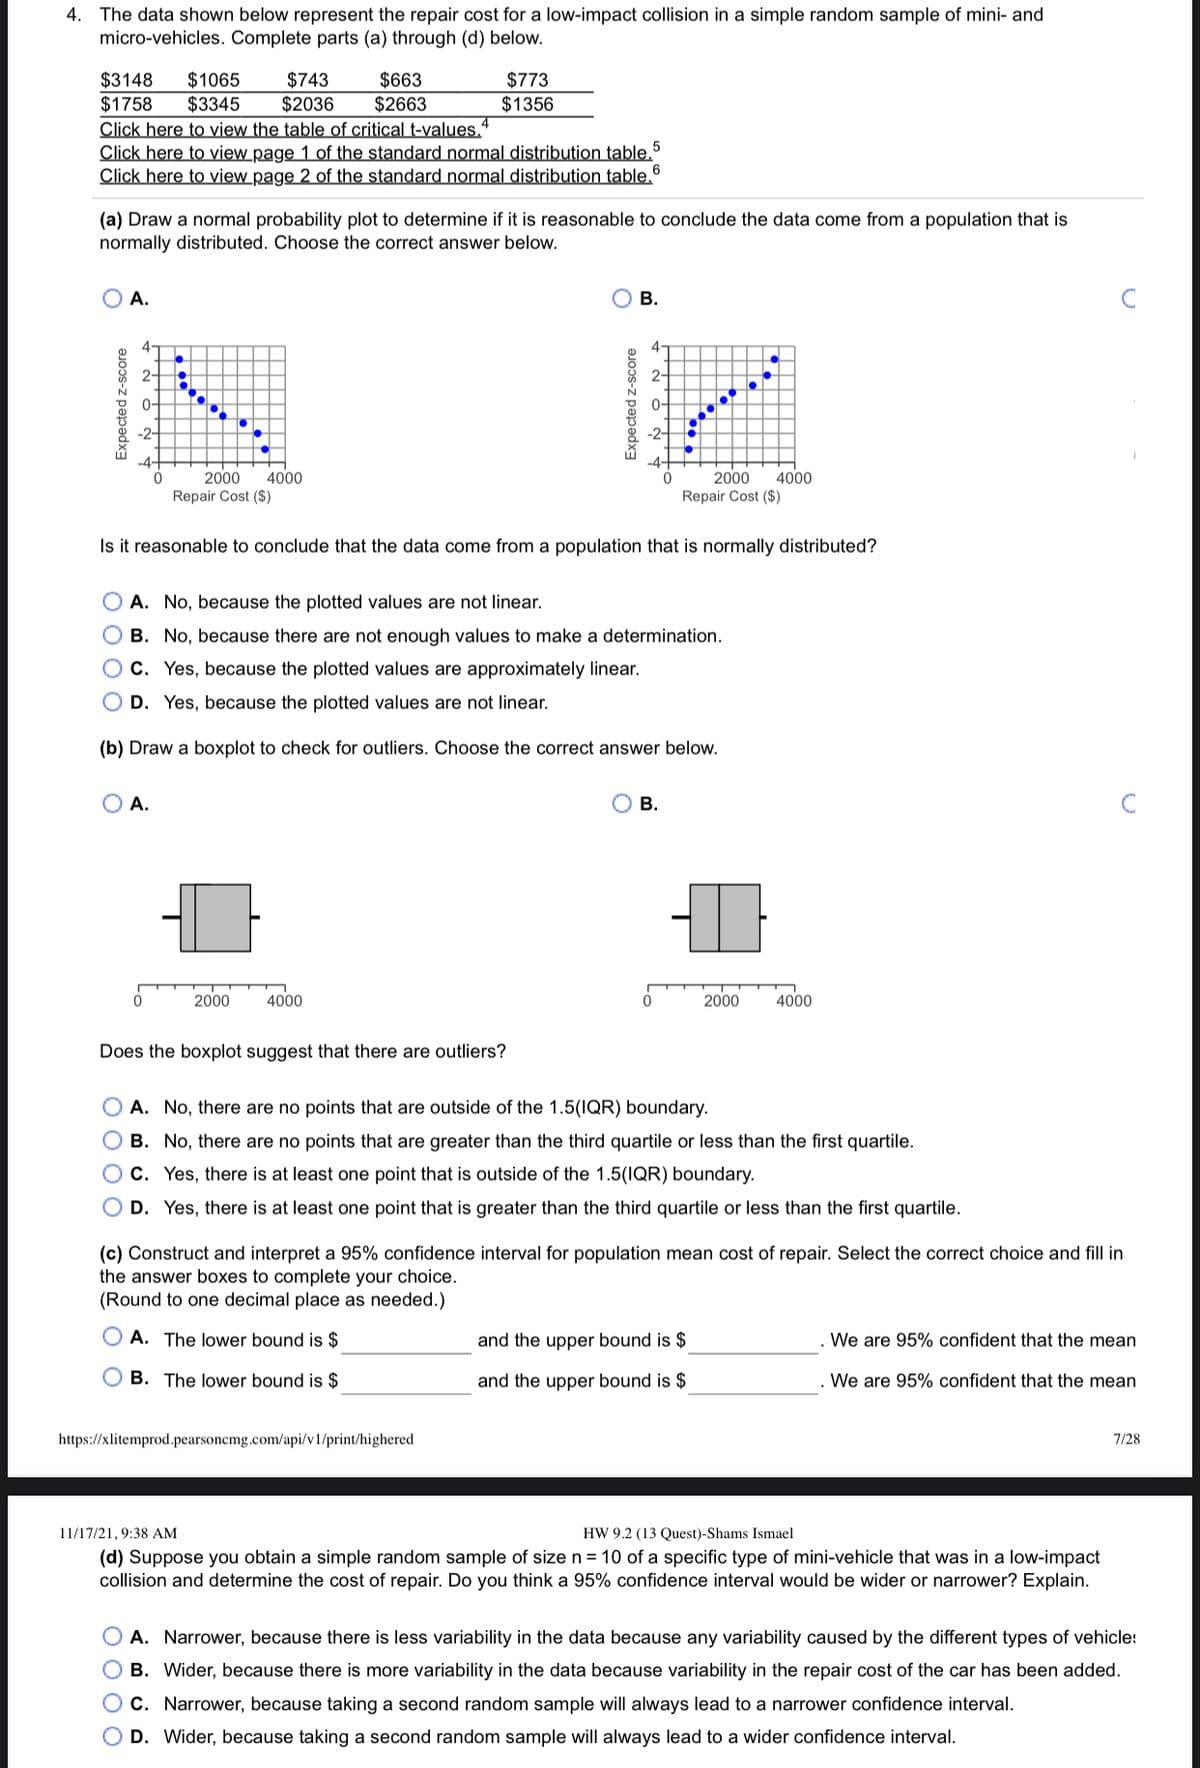
The data shown below represent the repair cost for a low-impact collision in a simple random sample of mini- and micro-vehicles. Complete parts (a) through (d) below. $3148 $1758 $1065 $3345 $743 $2036 $663 $2663 $773 $1356 Click here to view the table of critical t-values." Click here to view page 1 of the standard normal distribution table. Click here to view page 2 of the standard normal distribution table.6 5 (a) Draw a normal probability plot to determine if it is reasonable to conclude the data come from a population that is normally distributed. Choose the correct answer below. O A. ов. 4- 4- 2- 2- 0- 0- -2- -2- -4- 2000 4000 2000 4000 Repair Cost ($) Repair Cost ($) Is it reasonable to conclude that the data come from a population that is normally distributed? O A. No, because the plotted values are not linear. O B. No, because there are not enough values to make a determination. OC. Yes, because the plotted values are approximately linear. O D. Yes, because the plotted values are not linear. (b) Draw a boxplot to check for outliers. Choose the correct answer below. O A. В. 2000 4000 2000 4000 Does the boxplot suggest that there are outliers? O A. No, there are no points that are outside of the 1.5(IQR) boundary. O B. No, there are no points that are greater than the third quartile or less than the first quartile. O C. Yes, there is at least one point that is outside of the 1.5(IQR) boundary. O D. Yes, there is at least one point that is greater than the third quartile or less than the first quartile. (c) Construct and interpret a 95% confidence interval for population mean cost of repair. Select the correct choice and fill in the answer boxes to complete your choice. (Round to one decimal place as needed.) A. The lower bound is $ and the upper bound is $ We are 95% confident that the mean O B. The lower bound is $ and the upper bound is $ We are 95% confident that the mean /xlitemprod.pearsoncmg.com/api/v1/print/highered 7/28 Expected z-score Expected z-score
The data shown below represent the repair cost for a low-impact collision in a simple random sample of mini- and micro-vehicles. Complete parts (a) through (d) below. $3148 $1758 $1065 $3345 $743 $2036 $663 $2663 $773 $1356 Click here to view the table of critical t-values." Click here to view page 1 of the standard normal distribution table. Click here to view page 2 of the standard normal distribution table.6 5 (a) Draw a normal probability plot to determine if it is reasonable to conclude the data come from a population that is normally distributed. Choose the correct answer below. O A. ов. 4- 4- 2- 2- 0- 0- -2- -2- -4- 2000 4000 2000 4000 Repair Cost ($) Repair Cost ($) Is it reasonable to conclude that the data come from a population that is normally distributed? O A. No, because the plotted values are not linear. O B. No, because there are not enough values to make a determination. OC. Yes, because the plotted values are approximately linear. O D. Yes, because the plotted values are not linear. (b) Draw a boxplot to check for outliers. Choose the correct answer below. O A. В. 2000 4000 2000 4000 Does the boxplot suggest that there are outliers? O A. No, there are no points that are outside of the 1.5(IQR) boundary. O B. No, there are no points that are greater than the third quartile or less than the first quartile. O C. Yes, there is at least one point that is outside of the 1.5(IQR) boundary. O D. Yes, there is at least one point that is greater than the third quartile or less than the first quartile. (c) Construct and interpret a 95% confidence interval for population mean cost of repair. Select the correct choice and fill in the answer boxes to complete your choice. (Round to one decimal place as needed.) A. The lower bound is $ and the upper bound is $ We are 95% confident that the mean O B. The lower bound is $ and the upper bound is $ We are 95% confident that the mean /xlitemprod.pearsoncmg.com/api/v1/print/highered 7/28 Expected z-score Expected z-score

Glencoe Algebra 1, Student Edition, 9780079039897, 0079039898, 2018
18th Edition
ISBN:9780079039897
Author:Carter
Publisher:Carter
Chapter10: Statistics
Section10.4: Distributions Of Data
Problem 19PFA

Related questions
Question
Transcribed Image Text:4. The data shown below represent the repair cost for a low-impact collision in a simple random sample of mini- and
micro-vehicles. Complete parts (a) through (d) below.
$3148
$1758
Click here to view the table of critical t-values.“
Click here to view page 1 of the standard normal distribution table.
Click here to view page 2 of the standard normal distribution table.
$1065
$3345
$743
$2036
$663
$2663
$773
$1356
6
(a) Draw a normal probability plot to determine if it is reasonable to conclude the data come from a population that is
normally distributed. Choose the correct answer below.
O A.
В.
4-
4
2-
2-
0-
-2-
2000
4000
Repair Cost ($)
2000
4000
Repair Cost ($)
Is it reasonable to conclude that the data come from a population that is normally distributed?
A. No, because the plotted values are not linear.
O B. No, because there are not enough values to make a determination.
C. Yes, because the plotted values are approximately linear.
O D. Yes, because the plotted values are not linear.
(b) Draw a boxplot to check for outliers. Choose the correct answer below.
А.
O B.
2000
4000
2000
4000
Does the boxplot suggest that there are outliers?
A. No, there are no points that are outside of the 1.5(IQR) boundary.
O B. No, there are no points that are greater than the third quartile or less than the first quartile.
C. Yes, there is at least one point that is outside of the 1.5(IQR) boundary.
O D. Yes, there is at least one point that is greater than the third quartile or less than the first quartile.
(c) Construct and interpret a 95% confidence interval for population mean cost of repair. Select the correct choice and fill in
the answer boxes to complete your choice.
(Round to one decimal place as needed.)
O A. The lower bound is $
and the upper bound is $
We are 95% confident that the mean
B. The lower bound is $
and the upper bound is $
. We are 95% confident that the mean
https://xlitemprod.pearsonemg.com/api/v1/print/highered
7/28
11/17/21, 9:38 AM
HW 9.2 (13 Quest)-Shams Ismael
(d) Suppose you obtain a simple random sample of size n = 10 of a specific type of mini-vehicle that was in a low-impact
collision and determine the cost of repair. Do you think a 95% confidence interval would be wider or narrower? Explain.
O A. Narrower, because there is less variability in the data because any variability caused by the different types of vehicle:
B. Wider, because there is more variability in the data because variability in the repair cost of the car has been added.
C. Narrower, because taking a second random sample will always lead to a narrower confidence interval.
O D. Wider, because taking a second random sample will always lead to a wider confidence interval.
Expected z-score
Expected z-score
O O O O
O O
O 0 0 O
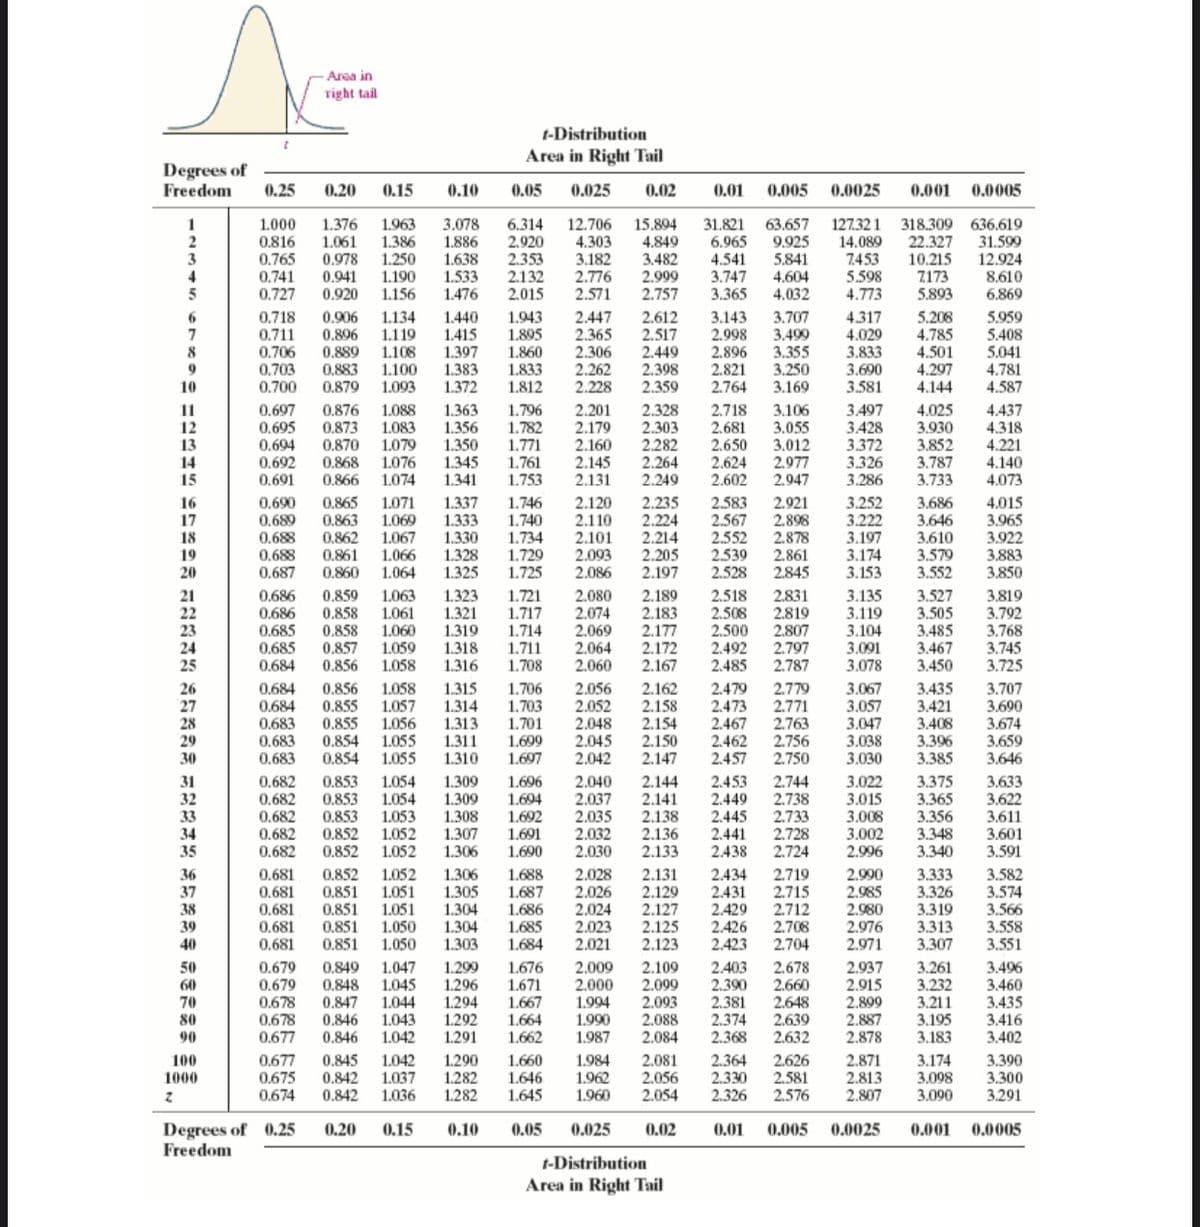
Transcribed Image Text:Area in
right tail
t-Distribution
Area in Right Tail
Degrees of
Freedom
0,25
0.20
0.15
0.10
0.05
0.025
0.02
0.01
0.005
0.0025
0.001
0.0005
1.000
0.816
0.765
0.741
0.727
1.376
1.061
0.978
0.941
0.920
1.963
1.386
1.250
1.190
1.156
3.078
1.886
1.638
1.533
1.476
6.314
2.920
2.353
2.132
2.015
12.706
4.303
3.182
2.776
2.571
15.894
4.849
3.482
2.999
2.757
31.821
6.965
4.541
3.747
3.365
63.657
9.925
5.841
4.604
4.032
127.32 1
14.089
7453
5.598
4.773
318.309 636.619
22.327
10.215
7173
5.893
31.599
12.924
8,610
6.869
5
0.718
0.711
0.706
0.703
0.700
0.906
0.896
0.889
0.883
0.879
1.134
1.119
1.108
1.100
1.093
1.440
1.415
1.397
1.383
1.372
1.943
1.895
1.860
1.833
1.812
2.447
2.365
2.306
2.262
2.228
2.612
2.517
2.449
2.398
2.359
3.143
2.998
2.896
2.821
2.764
3.707
3.499
3.355
3.250
3.169
4.317
4.029
3.833
3.690
3.581
5.208
4.785
4.501
4.297
4.144
5.959
5.408
5.041
4.781
4.587
6
8
10
11
12
13
14
15
0.697
0.695
0.694
0.692
0.691
0.876
0.873
0.870
0.868
0.866
1.088
1.083
1.079
1.076
1.074
1.363
1.356
1.350
1.345
1.341
1.796
1.782
1.771
1.761
1.753
2.201
2.179
2.160
2.145
2.131
2.328
2.303
2.282
2.264
2.249
2.718
2.681
2.650
2.624
2.602
3.106
3.055
3.012
2.977
2.947
3.497
3.428
3.372
3.326
3.286
4.025
3.930
3.852
3.787
3.733
4.437
4.318
4.221
4.140
4.073
0.690
0,689
0.865
0.863
0.862
1.746
1.740
1.734
1.729
1.725
2.235
2.224
2.214
2.205
2.197
2.583
2.567
2.552
2.539
2.528
2.921
2.898
2.878
2.861
2.845
3.252
3.222
3.197
3.174
3.153
4.015
3.965
3.922
3.883
3.850
1.071
1.069
1.337
1.333
1.330
1.328
1.325
3.686
3.646
3.610
3.579
3.552
16
17
18
19
20
0.688
0.688
0.687
1.067
1.066
1.064
2.120
2.110
2.101
2.093
2.086
0.861
0,860
0.686
0.686
0.685
0.685
0.684
0.859
0.858
0.858
0.857
0.856
1.063
1.061
1.060
1.059
1.058
1.323
1.321
1.319
1.318
1.316
1.721
1.717
1.714
1.711
1.708
2.080
2.074
2.069
2.064
2.060
2.189
2.183
2.177
2.172
2.167
2.518
2.508
2.500
2.492
2.485
2.831
2.819
2.807
2.797
2.787
3.135
3.119
3.104
3.091
3.078
3.527
3.505
3.485
3.467
3.450
3.819
3.792
3.768
3.745
3.725
21
0.684
0.684
0.683
0.683
0.683
0.856
0,855
0.855
1.058
1.057
1.056
1.055
1.055
1.315
1.314
1.313
1.311
1.310
1.706
1.703
1.701
1.699
1.697
2.056
2.052
2.048
2.045
2.042
2.162
2.158
2.154
2.150
2.147
2.479
2.473
2.467
2.462
2.457
2.779
2.771
2.763
2.756
2.750
3.067
3.057
3.047
3.038
3.030
3.435
3.421
3.408
3.396
3.385
3.707
3.690
3.674
3.659
3.646
0.854
0.854
0.682
0.682
0.682
0.682
0.682
0.853
0.853
0.853
0.852
0.852
1.054
1.054
1.053
1.052
1.052
1.309
1.309
1.308
1.307
1.306
1.696
1.694
1.692
1.691
1.690
2.040
2.037
2.035
2.032
2.030
2.144
2.141
2.138
2.136
2.133
2.453
2.449
2.445
2.441
2.438
2.744
2.738
2.733
2.728
2.724
3.022
3.015
3.008
3.002
2.996
3.375
3.365
3.356
3.348
3.340
31
3.633
3.622
3.611
3.601
3.591
34
35
0.681
0.681
0.681
1.306
1.305
1.304
1.304
1.303
2.131
2.129
2.127
2.125
2.123
3.582
3.574
3.566
3.558
3.551
0.852
36
37
38
39
40
1.688
1.687
1.686
1.685
1.684
2.028
2.026
2.024
2.023
2.021
2.434
2.431
2.429
2.426
2.423
2.719
2.715
2.712
2.708
2.704
3.333
3.326
3.319
3.313
3.307
1.052
2.990
2.985
2.980
2.976
2.971
0.851
1.051
0.851 1.051
0.851 1.050
0.851
0.681
0.681
1.050
50
60
70
80
90
0.679
0.679
0.678
0.678
0.677
0.849
0.848
0.847
0.846
0.846
1.047
1.045
1.044
1.043
1.042
1.299
1.296
1.294
1.292
1.291
1.676
1.671
1.667
1.664
1.662
2.009
2.000
1.994
1.990
1.987
2.109
2.099
2.093
2.088
2.084
2.403
2.390
2.381
2.374
2.368
2.678
2.660
2.648
2.639
2.632
2.937
2.915
2.899
2.887
2.878
3.261
3.232
3.211
3.195
3.183
3.496
3.460
3.435
3.416
3.402
0.845
0.842
0.842
1.042
1.037
1.036
1.290
1.282
1.282
1.660
1.646
1.645
1.984
1.962
1.960
2.081
2.056
2.054
2.871
2.813
2.807
100
0.677
0.675
0.674
2.364
2.330
2.326
2.626
2.581
2.576
3.174
3.098
3.090
3.390
3.300
3.291
1000
Degrees of 0.25
Freedom
0.20
0.15
0.10
0.05
0.025
0.02
0.01
0.005
0.0025
0.001
0.0005
t-Distribution
Area in Right Tail
Expert Solution
This question has been solved!
Explore an expertly crafted, step-by-step solution for a thorough understanding of key concepts.

This is a popular solution!

Trending now
This is a popular solution!

Step by step
Solved in 2 steps with 2 images

Recommended textbooks for you
Glencoe Algebra 1, Student Edition, 9780079039897…
Algebra
ISBN:
9780079039897
Author:
Carter
Publisher:
McGraw Hill
Glencoe Algebra 1, Student Edition, 9780079039897…
Algebra
ISBN:
9780079039897
Author:
Carter
Publisher:
McGraw Hill