The data shown to the right represent the age (in weeks) at which babies first crawl, based on a survey of 12 mothers. Complete parts (a) through (c) below. 52 35 O 26 30 44 47 56 37 37 54 Click here to view the table of critical t-values Click here to view page 1 of the standard normal distribution table. Click here 52 35 view page 2 of the standard normal distribution table. OA. OB. Oc. OD. ... 20 30 40 50 60 Age (in weeks) 20 30 40 50 60 Age (in weeks) 20 30 40 50 60 Age (in weeks) 20 30 40 50 60 Age (in weeks) Is it reasonable to conclude that the data come from a population that is normally distributed? O A. No, because there are not enough values to make a determination. O B. Yes, because the plotted values are approximately linear. OC. No, because the plotted values are not linear. O D. Yes, because the plotted values are not linear. (b) Draw a boxplot to check for outliers. Choose the correct answer below. asaosz papada O 0os z papadxa
The data shown to the right represent the age (in weeks) at which babies first crawl, based on a survey of 12 mothers. Complete parts (a) through (c) below. 52 35 O 26 30 44 47 56 37 37 54 Click here to view the table of critical t-values Click here to view page 1 of the standard normal distribution table. Click here 52 35 view page 2 of the standard normal distribution table. OA. OB. Oc. OD. ... 20 30 40 50 60 Age (in weeks) 20 30 40 50 60 Age (in weeks) 20 30 40 50 60 Age (in weeks) 20 30 40 50 60 Age (in weeks) Is it reasonable to conclude that the data come from a population that is normally distributed? O A. No, because there are not enough values to make a determination. O B. Yes, because the plotted values are approximately linear. OC. No, because the plotted values are not linear. O D. Yes, because the plotted values are not linear. (b) Draw a boxplot to check for outliers. Choose the correct answer below. asaosz papada O 0os z papadxa

MATLAB: An Introduction with Applications
6th Edition
ISBN:9781119256830
Author:Amos Gilat
Publisher:Amos Gilat
Chapter1: Starting With Matlab
Section: Chapter Questions
Problem 1P

Related questions

Question
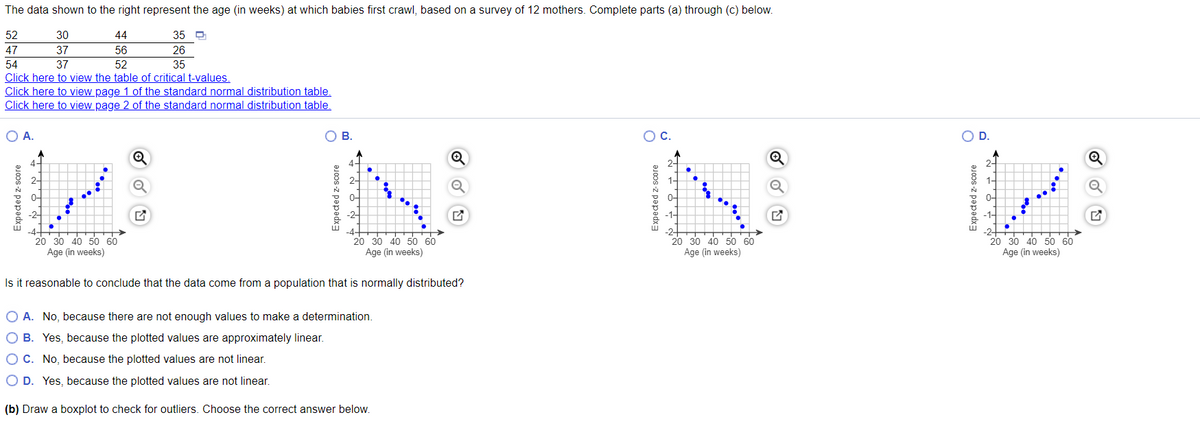
Transcribed Image Text:The data shown to the right represent the age (in weeks) at which babies first crawl, based on a survey of 12 mothers. Complete parts (a) through (c) below.
52
30
44
35 O
47
37
56
26
54
37
52
35
Click here to view the table of critical t-values.
Click here to view page 1 of the standard normal distribution table.
Click here to view page 2 of the standard normal distribution table.
O A.
OB.
OC.
OD.
Q
-2-
20 30 40 50 60
Age (in weeks)
20 30 40 50 60
Age (in weeks)
20 30 40 50 60
Age (in weeks)
30 40 50 60
Age (in weeks)
Is it reasonable to conclude that the data come from a population that is normally distributed?
O A. No, because there are not enough values to make a determination.
O B. Yes, because the plotted values are approximately linear.
O C. No, because the plotted values are not linear.
O D. Yes, because the plotted values are not linear.
(b) Draw a boxplot to check for outliers. Choose the correct answer below.
Expeded z-score
Expected z-score
xpected z-score
Expected z-score
Expert Solution
This question has been solved!
Explore an expertly crafted, step-by-step solution for a thorough understanding of key concepts.

This is a popular solution!

Trending now
This is a popular solution!

Step by step
Solved in 2 steps with 2 images

Knowledge Booster


Learn more about
Need a deep-dive on the concept behind this application? Look no further. Learn more about this topic, statistics and related others by exploring similar questions and additional content below.Recommended textbooks for you
MATLAB: An Introduction with Applications
Statistics
ISBN:
9781119256830
Author:
Amos Gilat
Publisher:
John Wiley & Sons Inc

Probability and Statistics for Engineering and th…
Statistics
ISBN:
9781305251809
Author:
Jay L. Devore
Publisher:
Cengage Learning

Statistics for The Behavioral Sciences (MindTap C…
Statistics
ISBN:
9781305504912
Author:
Frederick J Gravetter, Larry B. Wallnau
Publisher:
Cengage Learning
MATLAB: An Introduction with Applications
Statistics
ISBN:
9781119256830
Author:
Amos Gilat
Publisher:
John Wiley & Sons Inc
Probability and Statistics for Engineering and th…
Statistics
ISBN:
9781305251809
Author:
Jay L. Devore
Publisher:
Cengage Learning
Statistics for The Behavioral Sciences (MindTap C…
Statistics
ISBN:
9781305504912
Author:
Frederick J Gravetter, Larry B. Wallnau
Publisher:
Cengage Learning

Elementary Statistics: Picturing the World (7th E…
Statistics
ISBN:
9780134683416
Author:
Ron Larson, Betsy Farber
Publisher:
PEARSON

The Basic Practice of Statistics
Statistics
ISBN:
9781319042578
Author:
David S. Moore, William I. Notz, Michael A. Fligner
Publisher:
W. H. Freeman

Introduction to the Practice of Statistics
Statistics
ISBN:
9781319013387
Author:
David S. Moore, George P. McCabe, Bruce A. Craig
Publisher:
W. H. Freeman