
MATLAB: An Introduction with Applications
6th Edition
ISBN: 9781119256830
Author: Amos Gilat
Publisher: John Wiley & Sons Inc
expand_more
expand_more
format_list_bulleted
Related questions
Concept explainers
Question
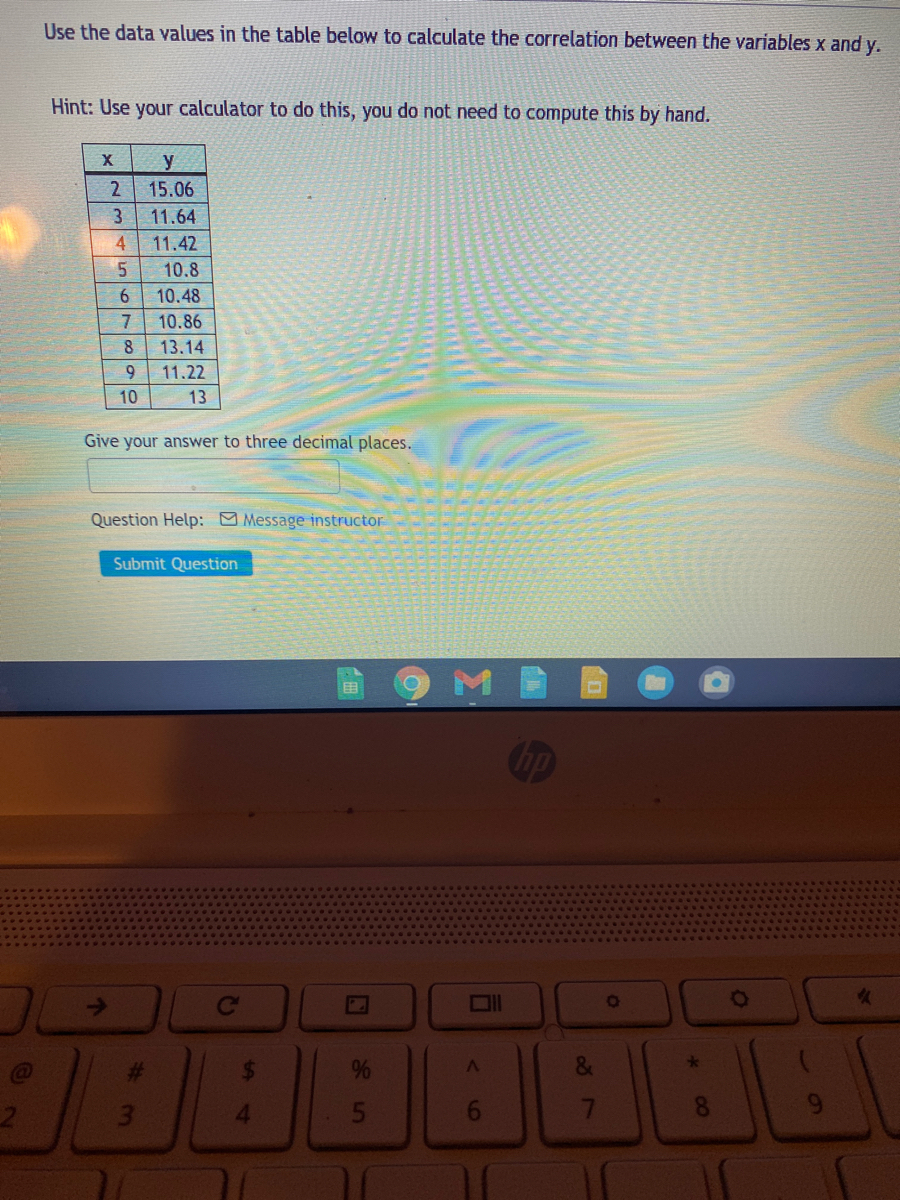

Transcribed Image Text:Use the data values in the table below to calculate the correlation between the variables x and y.
Hint: Use your calculator to do this, you do not need to compute this by hand.
y
2
15.06
11.64
4.
11.42
5.
10.8
10.48
10.86
13.14
9.
11.22
10
13
Give your answer to three decimal places.
Question Help: Message instructor
Submit Question
M
国
op
Co
OIl
4.
<6
35
%2
Expert Solution
This question has been solved!
Explore an expertly crafted, step-by-step solution for a thorough understanding of key concepts.

This is a popular solution

Trending nowThis is a popular solution!

Step by stepSolved in 3 steps with 2 images

Knowledge Booster


Learn more about
Need a deep-dive on the concept behind this application? Look no further. Learn more about this topic, statistics and related others by exploring similar questions and additional content below.Similar questions
- Dataset physical is available here. The figure for this exercise is a scatterplot of y 61 60 Head circumference (cm) gཆ ཆུ 56 55 54 59- 58 57 = head circumference (centimeters) versus x = height (inches) for 30 females. 53 60 62 64 66 Height (in.) 68 70 72 (a) Which association does the plot show between the two variables? Explain. There is a positive association since the average head circumference seems to decrease as height increases. There is a negative association since the average head circumference seems to increase as height increases. There is a negative association since the average head circumference seems to decrease as height increases. There is a positive association since the average head circumference seems to increase as height increases. There is no association since the average head circumference is approximately the same across heights. (b) One data point appears to be an outlier. What are the approximate values of height and head circumference for that point?…arrow_forwardWhat type of relationship exists between the two variables x and y in the scatter plot? A.Positive correlation B.No correlation C.Negative correlation D.None of the choicesarrow_forwardI need correlation coefficient ,test statistic , p value & conclusion pls help I need in an hourarrow_forward
- Please solve and circle your answersarrow_forwardUse a calculator or computer software to generate a normal quantile plot for the data in the accompanying table. Then determine whether the data come from a normally distributed population. Click the icon to view the data set. Generate a normal quantile plot for the data. Choose the correct graph below. OA. 3.00 2.00- 1.00- 0.00- -1.00- Q Q -2.00 -3.00 100 200 300 400 500 0 X Value OB. 3.00 2.00- 1.00- 0.00- -1.00- -2.00- -3.00- ... 0 100 200 300 400 500 X Value Q Q G O C. 3.00 2.00 P 1.00 0.00- -1.00- -2.00- 0 100 200 300 400 500 X Value -3.00+ Determine whether the data come from a normally distributed population. Choose the correct answer below. OA. The distribution is not normal. The points are not reasonably close to a straight line. OB. The distribution is normal. The points show a systematic pattern that is not a straight-line pattern. OC. The distribution is not normal. The points show a systematic pattern that is not a straight-line pattern. OD. The distribution is normal. The…arrow_forwardA study was done to look at the relationship between number of movies people watch at the theater each year and the number of books that they read each year. The results of the survey are shown below. Movies 10 7 6 10 0 9 1 6 Books 0 0 -0 0 9 0 9 -0 Use the model to predict the number of books read per year for someone who watches 3 movies per year.Books per year = (Please round your answer to the nearest whole number.) Interpret the slope of the regression line in the context of the question: The slope has no practical meaning since people cannot read a negative number of books. As x goes up, y goes down. For every additional movie that people watch each year, there tends to be an average decrease of 0.98 books read. Interpret the y-intercept in the context of the question: The y-intercept has no practical meaning for this study. If someone watches 0 movies per year, then that person will read 8 books this year. The best prediction for a person who doesn't watch…arrow_forward
- Need the first 3arrow_forwardSolve this example in the picture below, read the question carefully and answer it correctly. Please solve the work accurately and make sure that you check your work, this deals with correlations.arrow_forwardSolve for the slope, y-intercept, equation of the trend line, the correlation coefficient, and the coefficient of determination for the following the data set. Show your work and explain the steps you used to solve. Round your answer to the nearest hundredth.arrow_forward
arrow_back_ios
SEE MORE QUESTIONS
arrow_forward_ios
Recommended textbooks for you
- MATLAB: An Introduction with ApplicationsStatisticsISBN:9781119256830Author:Amos GilatPublisher:John Wiley & Sons Inc
 Probability and Statistics for Engineering and th...StatisticsISBN:9781305251809Author:Jay L. DevorePublisher:Cengage Learning
 Statistics for The Behavioral Sciences (MindTap C...StatisticsISBN:9781305504912Author:Frederick J Gravetter, Larry B. WallnauPublisher:Cengage Learning
  Elementary Statistics: Picturing the World (7th E...StatisticsISBN:9780134683416Author:Ron Larson, Betsy FarberPublisher:PEARSON
 The Basic Practice of StatisticsStatisticsISBN:9781319042578Author:David S. Moore, William I. Notz, Michael A. FlignerPublisher:W. H. Freeman
 Introduction to the Practice of StatisticsStatisticsISBN:9781319013387Author:David S. Moore, George P. McCabe, Bruce A. CraigPublisher:W. H. Freeman
MATLAB: An Introduction with Applications
Statistics
ISBN:9781119256830
Author:Amos Gilat
Publisher:John Wiley & Sons Inc
Probability and Statistics for Engineering and th...
Statistics
ISBN:9781305251809
Author:Jay L. Devore
Publisher:Cengage Learning
Statistics for The Behavioral Sciences (MindTap C...
Statistics
ISBN:9781305504912
Author:Frederick J Gravetter, Larry B. Wallnau
Publisher:Cengage Learning
Elementary Statistics: Picturing the World (7th E...
Statistics
ISBN:9780134683416
Author:Ron Larson, Betsy Farber
Publisher:PEARSON
The Basic Practice of Statistics
Statistics
ISBN:9781319042578
Author:David S. Moore, William I. Notz, Michael A. Fligner
Publisher:W. H. Freeman
Introduction to the Practice of Statistics
Statistics
ISBN:9781319013387
Author:David S. Moore, George P. McCabe, Bruce A. Craig
Publisher:W. H. Freeman