Amex PLC has gathered following information on the sales of face mask from April 2020 to September 2020. Month Sales ($) April l 17,000 18,000 19,500 22,000 May June July August 21,000 September 23,000 You are required to; a. Using linear trend equation forecast the sales of face masks for October 2020. b. Calculate the forecasted sales difference if you use 3-period weighted moving average designed with the following weights: July 0.2, August 0.3 and September 0.5.
Amex PLC has gathered following information on the sales of face mask from April 2020 to September 2020. Month Sales ($) April l 17,000 18,000 19,500 22,000 May June July August 21,000 September 23,000 You are required to; a. Using linear trend equation forecast the sales of face masks for October 2020. b. Calculate the forecasted sales difference if you use 3-period weighted moving average designed with the following weights: July 0.2, August 0.3 and September 0.5.

Glencoe Algebra 1, Student Edition, 9780079039897, 0079039898, 2018
18th Edition
ISBN:9780079039897
Author:Carter
Publisher:Carter
Chapter4: Equations Of Linear Functions
Section4.5: Correlation And Causation
Problem 2CYU

Related questions
Question
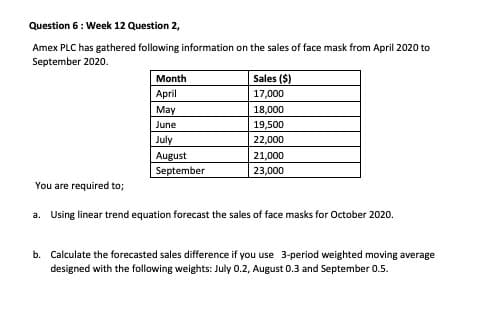
Transcribed Image Text:Question 6: Week 12 Question 2,
Amex PLC has gathered following information on the sales of face mask from April 2020 to
September 2020.
Month
Sales ($)
April
17,000
May
18,000
June
19,500
July
22,000
August
21,000
September
23,000
You are required to;
a. Using linear trend equation forecast the sales of face masks for October 2020.
b. Calculate the forecasted sales difference if you use 3-period weighted moving average
designed with the following weights: July 0.2, August 0.3 and September 0.5.
Expert Solution
This question has been solved!
Explore an expertly crafted, step-by-step solution for a thorough understanding of key concepts.

Step by step
Solved in 4 steps

Knowledge Booster


Learn more about
Need a deep-dive on the concept behind this application? Look no further. Learn more about this topic, statistics and related others by exploring similar questions and additional content below.Recommended textbooks for you
Glencoe Algebra 1, Student Edition, 9780079039897…
Algebra
ISBN:
9780079039897
Author:
Carter
Publisher:
McGraw Hill
Glencoe Algebra 1, Student Edition, 9780079039897…
Algebra
ISBN:
9780079039897
Author:
Carter
Publisher:
McGraw Hill