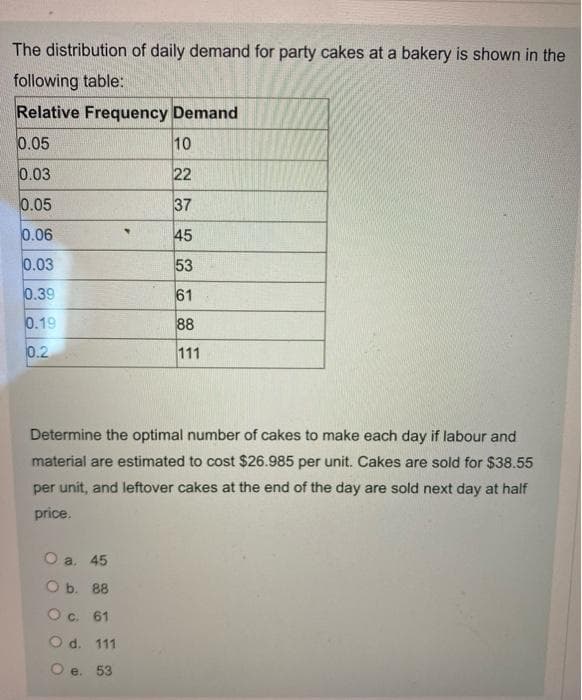
The distribution of daily demand for party cakes at a bakery is shown in following table: Relative Frequency Demand 0.05 10 0.03 22 0.05 37 0.06 45 0.03 53 0 30


Q: The Saki motorcycle dealer in the Minneapolis–St. Paul area wants to make an accurate forecast of…
A: a) The Moving Average Forecast method uses the data from the past periods to forecast the value of…
Q: Which time-series model below assumes that demand in the next period will be equal to the most…
A: A time series is a series of data pinpoints (Listed or graphed) in the time order. Most typically, a…
Q: Given this frequency distribution, what demand values would be associated with the following random…
A: The answer is as below:
Q: 2 - 118
A: Period Data 1 123 2 118 3 109 4 112 5 100 6 110 7 124
Q: obtained
A: The answer to this question is true.
Q: In January, a car dealer predicted February demand for 142 Ford Mustangs. Actual February demand was…
A: Exponential smoothing is a method used for short term forecast value and it gives rough idea to…
Q: Yearly Sales at the Local Gift Shop (in Dollars) Year 2000 2001 2002 2003 2004 2005 2006 Sales…
A: Simple Moving Average ForecastIt uses historical data to generate a forecast. Works well when demand…
Q: The operations manager of a company extructed the following annual demand data from the research and…
A: Find the Given details below: Given Details: Quarters Demand 1 120 2 90 3 100 4 75 5…
Q: The tracking signals (TS) computed using past demand history for three different products are as…
A: This question is related to the topic-forecasting approach and this topic fall under the operations…
Q: Given the following data on the number of pints of ice cream sold at a local ice cream store for a 3…
A: A moving average is a statistical strategy for finding overall trends in a data set by averaging any…
Q: (a) Make a line chart for an m-period moving average to the exchange rate data shown below with m =…
A: Moving averages are used to forecast the value of next period using the data of past periods.…
Q: Historical demand for a product is as follows. The sales manager wants to test various forecasting…
A: a) Calculate forecast using three month moving average form April to September. The formula is used…
Q: The seasonal index for the month of February in 2019 is: O A. 40% B. 60% C. 160% D. 5%
A: n = number of periods
Q: The fictitious Haskins & Collins Ice Cream Store needs an accurate estimate of demand. The owner of…
A: Find the Given details below: Given details: Quarter Year 1 2 3 4 January - March 370…
Q: Quarterly boat sales over a two-year period are provided in the table below. Suppose we expect year…
A: Year 1: Average demand = 8+10+12+94=9.75 Year 2: Average demand = 8+11+14+104=10.75
Q: Apply the 3-years moving average method to forecast the required demand for the year 2021 from the…
A: Years Demand 2012 245 2013 325 2014 300 2015 350 2016 295 2017 400 2018 450 2019 380…
Q: Compute the MAD and tracking signal for each period.
A: ANSWER IS AS BELOW:
Q: a. Are annual sales increasing or decreasing? By how much? Annual sales are by bottles per year. b.…
A: Forecasting is a technique used to predict future outcomes on the basis of past data. In businesses…
Q: The Mr. Rifkı Çakıl Company can obtain accurate forecasts for 5 months based on firm orders. These…
A: Given: 100 workers 100 days No. of cookies produced = 17,00,000 No. of cookies produced per day =…
Q: A manufacturer sells a product in two regions. Weekly demand in each region is Normally distributed…
A: given, standard deviation = 300 weekly demand = 1000 correlation coefficient = -.35
Q: The following are monthly actual and forecast demand levels for May through December for units of a…
A: Forecast Error = Actual Demand - Forecast Demand Absolute Error = Positive value of Forecast Error
Q: Required / find the expected demand for 2008 in the simple moving average and based on four time…
A: The simple moving average is the forecasting tool to predict the future demand based on past values.…
Q: The manager of a fashionable restaurant open Wednesday through Saturday says that the restaurant…
A:
Q: Demand does not show any pattern is called _____________________.
A: Random demand refers to the demand that has no apparent pattern. Seasonal demand refers to the…
Q: 13 U) 977 is 88 978 is 93 979 is 99 980 is 109 00 units se estimate the value of demand for next 3…
A: THE ANSWER IS AS BELOW:
Q: 1. Which of the following is indicative of the season of heaviest demand when seasonality is…
A: The seasonal index of 1.25 indicates the season of heaviest demand because this is 125% that shows…
Q: Consider the manager of a large department store. Among other responsibilities, she is in charge of…
A: Deliberate the administrator of a large section store. Amid other tasks, she is in responsibility of…
Q: The demand of a product showed a decreasing pattern during the last period. If the two last values…
A: The demand of a product showed a decreasing pattern during the last period if the two last values…
Q: Lea Ray is the revenue manager at the 200-room Hilton Garden Inn. She tracks her occupancy and ADR…
A: Occupancy rate can be termed as the percentage or proportion of the rooms which are occupied in the…
Q: Compute the MAD and tracking signal for each period
A: ANSWER IS AS BELOW:
Q: The PPS Company assembles home air conditioning units for the local market. The projected demand…
A: Given details Month Workdays Demand January 21 1800 units February 19 2465 units March 20…
Q: 12.2. The manager of the I-85 Carpet Outlet needs to be able to forecast accurately the demand for…
A: Given-
Q: Given a forecast demand and an actual demand for a certain product, calculate the tracking signal…
A: Given-
Q: Given the Exponential Smoothing Method, Actual Demand alpha = .25 and Forecast Demand alpha = 0.75,…
A: The formula for forecast using the exponential smoothening method.
Q: The management decided to use the exponential smoothing to determine the projected monthly demand…
A:
Q: Question 6 Tech Company is a medium-sized consumer electronics retailer. The company reported…
A: Revenues (R) = $155,000,000 Cost of goods sold (COGS) = $110,050,000 Average inventory (AI) =…
Q: Given the following data, calculate the average demand and the standard deviation.
A: THE ANSWER IS AS BELOW:
Q: Given this frequency distribution, what demand values would be associated with the following random…
A:
Q: B. The owner of a small hardware store has noted a sales pattern that seems to parallel the number…
A:
Q: The forecast for the month of March considering smoothing coefficient as 0.75 is.....
A: Exponential smoothing is a forecasting method for a data with 1 variable that can be used to…
Q: Eastman Publishing Company is considering publishing an electronic textbook about spreadsheet…
A: Fixed cost F= $150,000 Variable cost c= $4 per book Selling price p= $43 per book Demand = 4000 - 6p…
Q: The manager of the Carpet City outlet needs to make an accurate forecast of the demand for Soft Shag…
A: Forecasting is very crucial for any business and nowadays businesses are surviving because of…
Q: Cadbury started an in-depth study to forecast customer demand based on data it previously Management…
A: Demand forecasting gives businesses vital information about their potential in their current market…
Q: The historical demand for four period is 62, 60, 72, and 67 respectively. Using the Naïve method,…
A: THE ANSWER IS AS BELOW:
Q: Consider the following actual and forecast demand levels for Big Mac hamburgers at a local…
A: Let, Ft+1 = Forecast for friday Yt = 48.00 Ft = 77.60 α = 0.40 Thus expression for the forecast for…
Q: The data shown are quarterly revenues (in $thousands) from Roget's Books from 2013-Q1 through…
A: Given data is
Q: What advantages does adjusted exponential smoothing have over a linear trend line for forecasted…
A: Adjusted exponential smoothing is a forecasting methodology that employs measurable and historical…
Q: Calculate four periods moving average forecast from the following last six periods Period Demand 1…
A: Period Demand 1 38 2 40 3 42 4 40 5 44 6 38
Q: Based on the information in the following table, use the Exponential Smoothing Approach (a = 0.3) to…
A: The question is related to the Exponential smoothing model. The Forecasted demand as per Exponential…
Q: 2G MTN Zambia ll 78% 3:30 PM < OperationsManagement_HW1.. 4.12 Consider the following actual and…
A: Given Data, Day Actual demand Forecast Demand Monday 88 88 Tuesday 72 88…

Step by step
Solved in 2 steps

- The Pigskin Company produces footballs. Pigskin must decide how many footballs to produce each month. The company has decided to use a six-month planning horizon. The forecasted monthly demands for the next six months are 10,000, 15,000, 30,000, 35,000, 25,000, and 10,000. Pigskin wants to meet these demands on time, knowing that it currently has 5000 footballs in inventory and that it can use a given months production to help meet the demand for that month. (For simplicity, we assume that production occurs during the month, and demand occurs at the end of the month.) During each month there is enough production capacity to produce up to 30,000 footballs, and there is enough storage capacity to store up to 10,000 footballs at the end of the month, after demand has occurred. The forecasted production costs per football for the next six months are 12.50, 12.55, 12.70, 12.80, 12.85, and 12.95, respectively. The holding cost incurred per football held in inventory at the end of any month is 5% of the production cost for that month. (This cost includes the cost of storage and also the cost of money tied up in inventory.) The selling price for footballs is not considered relevant to the production decision because Pigskin will satisfy all customer demand exactly when it occursat whatever the selling price is. Therefore. Pigskin wants to determine the production schedule that minimizes the total production and holding costs. Can you guess the results of a sensitivity analysis on the initial inventory in the Pigskin model? See if your guess is correct by using SolverTable and allowing the initial inventory to vary from 0 to 10,000 in increments of 1000. Keep track of the values in the decision variable cells and the objective cell.The Pigskin Company produces footballs. Pigskin must decide how many footballs to produce each month. The company has decided to use a six-month planning horizon. The forecasted monthly demands for the next six months are 10,000, 15,000, 30,000, 35,000, 25,000, and 10,000. Pigskin wants to meet these demands on time, knowing that it currently has 5000 footballs in inventory and that it can use a given months production to help meet the demand for that month. (For simplicity, we assume that production occurs during the month, and demand occurs at the end of the month.) During each month there is enough production capacity to produce up to 30,000 footballs, and there is enough storage capacity to store up to 10,000 footballs at the end of the month, after demand has occurred. The forecasted production costs per football for the next six months are 12.50, 12.55, 12.70, 12.80, 12.85, and 12.95, respectively. The holding cost incurred per football held in inventory at the end of any month is 5% of the production cost for that month. (This cost includes the cost of storage and also the cost of money tied up in inventory.) The selling price for footballs is not considered relevant to the production decision because Pigskin will satisfy all customer demand exactly when it occursat whatever the selling price is. Therefore. Pigskin wants to determine the production schedule that minimizes the total production and holding costs. As indicated by the algebraic formulation of the Pigskin model, there is no real need to calculate inventory on hand after production and constrain it to be greater than or equal to demand. An alternative is to calculate ending inventory directly and constrain it to be nonnegative. Modify the current spreadsheet model to do this. (Delete rows 16 and 17, and calculate ending inventory appropriately. Then add an explicit non-negativity constraint on ending inventory.)The Pigskin Company produces footballs. Pigskin must decide how many footballs to produce each month. The company has decided to use a six-month planning horizon. The forecasted monthly demands for the next six months are 10,000, 15,000, 30,000, 35,000, 25,000, and 10,000. Pigskin wants to meet these demands on time, knowing that it currently has 5000 footballs in inventory and that it can use a given months production to help meet the demand for that month. (For simplicity, we assume that production occurs during the month, and demand occurs at the end of the month.) During each month there is enough production capacity to produce up to 30,000 footballs, and there is enough storage capacity to store up to 10,000 footballs at the end of the month, after demand has occurred. The forecasted production costs per football for the next six months are 12.50, 12.55, 12.70, 12.80, 12.85, and 12.95, respectively. The holding cost incurred per football held in inventory at the end of any month is 5% of the production cost for that month. (This cost includes the cost of storage and also the cost of money tied up in inventory.) The selling price for footballs is not considered relevant to the production decision because Pigskin will satisfy all customer demand exactly when it occursat whatever the selling price is. Therefore. Pigskin wants to determine the production schedule that minimizes the total production and holding costs. Modify the Pigskin model so that there are eight months in the planning horizon. You can make up reasonable values for any extra required data. Dont forget to modify range names. Then modify the model again so that there are only four months in the planning horizon. Do either of these modifications change the optima] production quantity in month 1?
- Assume the demand for a companys drug Wozac during the current year is 50,000, and assume demand will grow at 5% a year. If the company builds a plant that can produce x units of Wozac per year, it will cost 16x. Each unit of Wozac is sold for 3. Each unit of Wozac produced incurs a variable production cost of 0.20. It costs 0.40 per year to operate a unit of capacity. Determine how large a Wozac plant the company should build to maximize its expected profit over the next 10 years.Seas Beginning sells clothing by mail order. An important question is when to strike a customer from the companys mailing list. At present, the company strikes a customer from its mailing list if a customer fails to order from six consecutive catalogs. The company wants to know whether striking a customer from its list after a customer fails to order from four consecutive catalogs results in a higher profit per customer. The following data are available: If a customer placed an order the last time she received a catalog, then there is a 20% chance she will order from the next catalog. If a customer last placed an order one catalog ago, there is a 16% chance she will order from the next catalog she receives. If a customer last placed an order two catalogs ago, there is a 12% chance she will order from the next catalog she receives. If a customer last placed an order three catalogs ago, there is an 8% chance she will order from the next catalog she receives. If a customer last placed an order four catalogs ago, there is a 4% chance she will order from the next catalog she receives. If a customer last placed an order five catalogs ago, there is a 2% chance she will order from the next catalog she receives. It costs 2 to send a catalog, and the average profit per order is 30. Assume a customer has just placed an order. To maximize expected profit per customer, would Seas Beginning make more money canceling such a customer after six nonorders or four nonorders?If a monopolist produces q units, she can charge 400 4q dollars per unit. The variable cost is 60 per unit. a. How can the monopolist maximize her profit? b. If the monopolist must pay a sales tax of 5% of the selling price per unit, will she increase or decrease production (relative to the situation with no sales tax)? c. Continuing part b, use SolverTable to see how a change in the sales tax affects the optimal solution. Let the sales tax vary from 0% to 8% in increments of 0.5%.
- The Tinkan Company produces one-pound cans for the Canadian salmon industry. Each year the salmon spawn during a 24-hour period and must be canned immediately. Tinkan has the following agreement with the salmon industry. The company can deliver as many cans as it chooses. Then the salmon are caught. For each can by which Tinkan falls short of the salmon industrys needs, the company pays the industry a 2 penalty. Cans cost Tinkan 1 to produce and are sold by Tinkan for 2 per can. If any cans are left over, they are returned to Tinkan and the company reimburses the industry 2 for each extra can. These extra cans are put in storage for next year. Each year a can is held in storage, a carrying cost equal to 20% of the cans production cost is incurred. It is well known that the number of salmon harvested during a year is strongly related to the number of salmon harvested the previous year. In fact, using past data, Tinkan estimates that the harvest size in year t, Ht (measured in the number of cans required), is related to the harvest size in the previous year, Ht1, by the equation Ht = Ht1et where et is normally distributed with mean 1.02 and standard deviation 0.10. Tinkan plans to use the following production strategy. For some value of x, it produces enough cans at the beginning of year t to bring its inventory up to x+Ht, where Ht is the predicted harvest size in year t. Then it delivers these cans to the salmon industry. For example, if it uses x = 100,000, the predicted harvest size is 500,000 cans, and 80,000 cans are already in inventory, then Tinkan produces and delivers 520,000 cans. Given that the harvest size for the previous year was 550,000 cans, use simulation to help Tinkan develop a production strategy that maximizes its expected profit over the next 20 years. Assume that the company begins year 1 with an initial inventory of 300,000 cans.It costs a pharmaceutical company 75,000 to produce a 1000-pound batch of a drug. The average yield from a batch is unknown but the best case is 90% yield (that is, 900 pounds of good drug will be produced), the most likely case is 85% yield, and the worst case is 70% yield. The annual demand for the drug is unknown, with the best case being 20,000 pounds, the most likely case 17,500 pounds, and the worst case 10,000 pounds. The drug sells for 125 per pound and leftover amounts of the drug can be sold for 30 per pound. To maximize annual expected profit, how many batches of the drug should the company produce? You can assume that it will produce the batches only once, before demand for the drug is known.In Problem 12 of the previous section, suppose that the demand for cars is normally distributed with mean 100 and standard deviation 15. Use @RISK to determine the best order quantityin this case, the one with the largest mean profit. Using the statistics and/or graphs from @RISK, discuss whether this order quantity would be considered best by the car dealer. (The point is that a decision maker can use more than just mean profit in making a decision.)
- The accompanying table shows a bookstore's estimated demand for a new calendar. The bookstore needs to decide whether to order100, 200, or 300 calendars for the start of the year. Each calendar costs the store$5 to purchase and can be sold for $13. The store can sell any unsold calendars back to its supplier for $3 each. Determine the number of calendars the bookstore should order to maximize its expected monetary value. Demand Probability 100 0.35 200 0.25 300 0.40 The bookstore should order---------calendars in order to have the maximum expected monetary value of $----- (Type a whole number.)1. At the beginning of each semester, BOOKY can order 60, 80, or 100 copies of the book from the publisher, each with differing discounts per book. The ordering costs are listed in the following table. Number of Books Ordered 60 80 100 Ordering Costs 6100 7700 9100 2. BOOKY can either sell the book at the retail price ($130 per copy) or offer a 10% discount ($117 per copy). The demand distributions under different selling prices are listed in the following tables. The demand distribution for the textbook when the selling price is $130 per copy. Demand Probability 70 0.6 90 0.4 The demand distribution for the textbook when the selling price is $117 per copy. Demand Probability 80 0.15 100 0.85 3. Any unmet demand for the textbook will be irrecoverable There are two decision variables in this decision problem: the ordering quantity and the selling price of the textbook. a) If BOOKY is allowed to return unsold textbooks to the publisher for a refund of…Jean Clark is the manager of the Midtown Saveway-Grocery Store. She now needs to replenish hersupply of strawberries. Her regular supplier can provide as many cases as she wants. However,because these strawberries already are very ripe, she will need to sell them tomorrow and thendiscard any that remain unsold. Jean estimates that she will be able to sell 12, 13, 14, or 15 casestomorrow. She can purchase the strawberries for $7 per case and sell them for $18 per case. Jeannow needs to decide how many cases to purchase. Jean has checked the store’s records on dailysales of strawberries. On this basis, she estimates that the prior probabilities are 0.1, 0.3, 0.4, and 0.2for being able to sell 12, 13, 14, and 15 cases of strawberries tomorrow. a. Develop a decision analysis formulation of this problem by identifying the decisionalternatives, the states of nature, and the payoff table. b. How many cases of strawberries should Jean purchase if she uses the maximin payoffcriterion? c. How…