The Dow Jones Industrial Average (DJIA) and the Standard & Poor's 500 (S&P 500) indexes are used as measures of overall movement in the stock market. The DJIA is based on the price movements of 30 large companies; the S&P 500 is an index composed of 500 stocks. Some say the S&P 500 is a better measure of stock market performance because it is broader based. The closing price for the DJIA and the S&P 500 for 15 weeks, beginning with January 6, 2012, follow (Barron's website, April 17, 2012). Date DJIA S&P January 6 January 13 January 20 January 27 February 3 February 10 February 17 February 24 March 2 March 9 March 16 March 23 March 30 April 5 April 13 12,360 12,422 12,720 12,660 12,862 12,801 12,950 12,983 12,978 12,922 13,233 13,081 13,212 13,060 12,850 1278 1289 1315 1316 1345 1343 1362 1366 1370 1371 1404 1397 1408 1398 1370 d. Did the estimated regression equation provide a good fit? Explain. c. Suppose that the closing price for the DJIA is 13,500. Predict the closing price for the S&P 500. f. Should we be concerned that the DJIA value of 13,500 used to predict the S&P 500 value in part (e) is beyond the range of the data used to develop the estimated regres- sion equation?
The Dow Jones Industrial Average (DJIA) and the Standard & Poor's 500 (S&P 500) indexes are used as measures of overall movement in the stock market. The DJIA is based on the price movements of 30 large companies; the S&P 500 is an index composed of 500 stocks. Some say the S&P 500 is a better measure of stock market performance because it is broader based. The closing price for the DJIA and the S&P 500 for 15 weeks, beginning with January 6, 2012, follow (Barron's website, April 17, 2012). Date DJIA S&P January 6 January 13 January 20 January 27 February 3 February 10 February 17 February 24 March 2 March 9 March 16 March 23 March 30 April 5 April 13 12,360 12,422 12,720 12,660 12,862 12,801 12,950 12,983 12,978 12,922 13,233 13,081 13,212 13,060 12,850 1278 1289 1315 1316 1345 1343 1362 1366 1370 1371 1404 1397 1408 1398 1370 d. Did the estimated regression equation provide a good fit? Explain. c. Suppose that the closing price for the DJIA is 13,500. Predict the closing price for the S&P 500. f. Should we be concerned that the DJIA value of 13,500 used to predict the S&P 500 value in part (e) is beyond the range of the data used to develop the estimated regres- sion equation?

Holt Mcdougal Larson Pre-algebra: Student Edition 2012
1st Edition
ISBN:9780547587776
Author:HOLT MCDOUGAL
Publisher:HOLT MCDOUGAL
Chapter11: Data Analysis And Probability
Section11.4: Collecting Data
Problem 6E

Related questions
Question
Transcribed Image Text:A TEXTBOOK -Statistics for Business and Economics (13th edition).pdf - Adobe Acrobat Reader DC
O X
File Edit View Sign Window Help
Home
Tools
TEXTBOOK -Statisti.. x
Assignment#4_B.S..
Sign In
(696 of 1122)
図 。
664
At least one signature has problems.
Signature Panel
Search 'Draw Rectangle'
Bookmarks
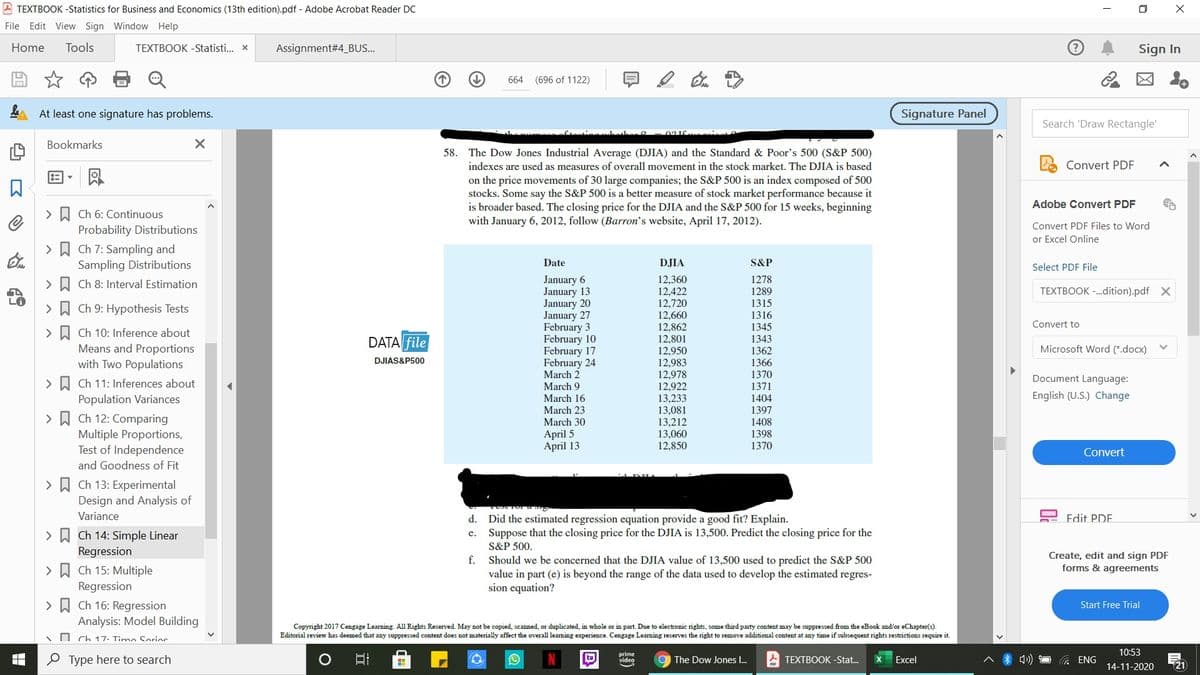
58. The Dow Jones Industrial Average (DJIA) and the Standard & Poor's 500 (S&P 500)
indexes are used as measures of overall movement in the stock market. The DJIA is based
Convert PDF
on the price movements of 30 large companies; the S&P 500 is an index composed of 500
stocks. Some say the S&P 500 is a better measure of stock market performance because it
is broader based. The closing price for the DJIA and the S&P 500 for 15 weeks, beginning
with January 6, 2012, follow (Barron's website, April 17, 2012).
Adobe Convert PDF
> A Ch 6: Continuous
Probability Distributions
Convert PDF Files to Word
or Excel Online
> A Ch 7: Sampling and
Sampling Distributions
Date
DJIA
S&P
Select PDF File
12,360
12,422
12,720
January 6
January 13
January 20
January 27
February 3
February 10
February 17
February 24
March 2
1278
> D Ch 8: Interval Estimation
1289
1315
1316
1345
1343
1362
1366
1370
1371
TEXTBOOK -.dition).pdf X
LO
> W Ch 9: Hypothesis Tests
12,660
Convert to
12,862
12,801
>
Ch 10: Inference about
DATA file
Means and Proportions
with Two Populations
Microsoft Word (*.docx)
12,950
12,983
12,978
12,922
DJIAS&P500
Document Language:
> A Ch 11: Inferences about
Population Variances
March 9
English (U.S.) Change
1404
1397
1408
1398
March 16
13,233
13,081
13,212
13,060
12,850
March 23
March 30
> A Ch 12: Comparing
Multiple Proportions,
Test of Independence
April 5
April 13
1370
Convert
and Goodness of Fit
> A Ch 13: Experimental
Design and Analysis of
Variance
d. Did the estimated regression equation provide a good fit? Explain.
Suppose that the closing price for the DJIA is 13,500. Predict the closing price for the
Edit PDE.
> W Ch 14: Simple Linear
e.
S&P 500.
Regression
Create, edit and sign PDF
forms & agreements
f.
Should we be concerned that the DJIA value of 13,500 used to predict the S&P 500
value in part (e) is beyond the range of the data used to develop the estimated regres-
sion equation?
> A Ch 15: Multiple
Regression
> A Ch 16: Regression
Start Free Trial
Analysis: Model Building
Copyright 2017 Cengage Learning. All Rights Reserved. May not be copied, scanned, or duplicated, in whole or in part. Due to electronic rights, some third party content may be suppressed from the eBook and/or eChapter(s).
Editorial review has deemed that any suppressed content does not materially affect the overall leaming experience. Cengage Leaming reserves the right to remove additional content at any time if subsequent rights restrictions require it.
O Ch 17. Timo Sorioc
10:53
O Type here to search
prime
video
The Dow Jones I.
TEXTBOOK -Stat.
Excel
ENG
14-11-2020
21
Expert Solution
This question has been solved!
Explore an expertly crafted, step-by-step solution for a thorough understanding of key concepts.

This is a popular solution!

Trending now
This is a popular solution!

Step by step
Solved in 2 steps

Knowledge Booster


Learn more about
Need a deep-dive on the concept behind this application? Look no further. Learn more about this topic, statistics and related others by exploring similar questions and additional content below.Recommended textbooks for you
Holt Mcdougal Larson Pre-algebra: Student Edition…
Algebra
ISBN:
9780547587776
Author:
HOLT MCDOUGAL
Publisher:
HOLT MCDOUGAL

College Algebra (MindTap Course List)
Algebra
ISBN:
9781305652231
Author:
R. David Gustafson, Jeff Hughes
Publisher:
Cengage Learning

Holt Mcdougal Larson Pre-algebra: Student Edition…
Algebra
ISBN:
9780547587776
Author:
HOLT MCDOUGAL
Publisher:
HOLT MCDOUGAL
College Algebra (MindTap Course List)
Algebra
ISBN:
9781305652231
Author:
R. David Gustafson, Jeff Hughes
Publisher:
Cengage Learning