The economy of Ashenvale is currently in a long-run equilibrium, depicted by point E, on the graph. Economy of Ashenvale Suppose that there is a negative AD shock to the economy and the AD curve shifts to the left, as shown by the AD, curve on the graph. The following steps are designed so that you can explain how the economy adapts to the shock. 2,400- 2,200 a. Using the point drawing tool, plot and label the new short-run equilibrium after this AD shock. 2,000 1,800- AS Carefully follow the instructions above, and only draw the required object. A 1,600- E 1400- ........ In the short run, the equilibrium price will be approximately $ and the new equilibrium quantity will be approximately 1,200- ADO 1.000 B00 AD, B00 400- 200- B,000 6,00 Real GDP (Y) 2.000 4,000 10,000
The economy of Ashenvale is currently in a long-run equilibrium, depicted by point E, on the graph. Economy of Ashenvale Suppose that there is a negative AD shock to the economy and the AD curve shifts to the left, as shown by the AD, curve on the graph. The following steps are designed so that you can explain how the economy adapts to the shock. 2,400- 2,200 a. Using the point drawing tool, plot and label the new short-run equilibrium after this AD shock. 2,000 1,800- AS Carefully follow the instructions above, and only draw the required object. A 1,600- E 1400- ........ In the short run, the equilibrium price will be approximately $ and the new equilibrium quantity will be approximately 1,200- ADO 1.000 B00 AD, B00 400- 200- B,000 6,00 Real GDP (Y) 2.000 4,000 10,000

Chapter10: Income And Expenditures Equilibrium
Section: Chapter Questions
Problem 17E

Related questions
Question
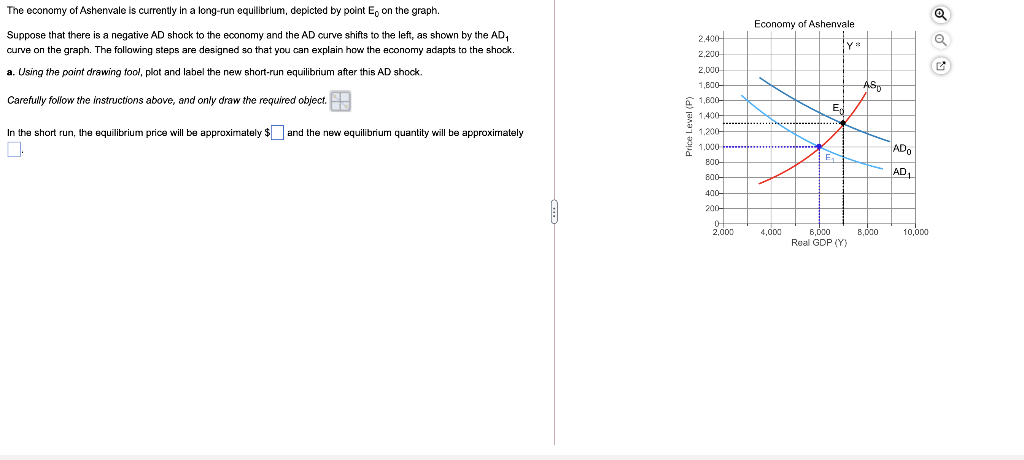
Transcribed Image Text:The economy of Ashenvale is currently in a long-run equilibrium, depicted by point E, on the graph.
Economy of Ashenvale
Suppose that there is a negative AD shock to the economy and the AD curve shifts to the left, as shown by the AD,
2,400-
curve on the graph. The following steps are designed so that you can explain how the economy adapts to the shock.
2,200
a. Using the point drawing tool, plot and label the new short-run equilibrium after this AD shock
2,000
1,800-
AS
Carefully follow the instructions above, and only draw the required object.
A 1,600-
E
1,400-
......
In the short run, the equilibrium price will be approximately $ and the new equilibrium quantity will be approximately
1,200-
ADn
1,000
E
B00
AD,
60
400
200-
6,000
Roal GDP (Y)
2,000
4 00
B,000
10,000
Price Level (P)
Expert Solution
This question has been solved!
Explore an expertly crafted, step-by-step solution for a thorough understanding of key concepts.

This is a popular solution!

Trending now
This is a popular solution!

Step by step
Solved in 2 steps with 1 images

Knowledge Booster


Learn more about
Need a deep-dive on the concept behind this application? Look no further. Learn more about this topic, economics and related others by exploring similar questions and additional content below.Recommended textbooks for you


Macroeconomics: Private and Public Choice (MindTa…
Economics
ISBN:
9781305506756
Author:
James D. Gwartney, Richard L. Stroup, Russell S. Sobel, David A. Macpherson
Publisher:
Cengage Learning
Macroeconomics: Private and Public Choice (MindTa…
Economics
ISBN:
9781305506756
Author:
James D. Gwartney, Richard L. Stroup, Russell S. Sobel, David A. Macpherson
Publisher:
Cengage Learning

Economics: Private and Public Choice (MindTap Cou…
Economics
ISBN:
9781305506725
Author:
James D. Gwartney, Richard L. Stroup, Russell S. Sobel, David A. Macpherson
Publisher:
Cengage Learning

