The Environmental Protection Agency (EPA) uses the Air Quality Index (AQI) as an Indicator of air pollution in a particular region. Higher numbers indicate increased air pollution. Suppose we collected AQI data for 26 sites in a rural region of the southeastem United States and 26 sites in an urbanized region of the southeastern US. Use the following data to test the following null hypothesis: Po: AQlrural - AQlurban Site Rural AQI Urban AQI 1 54 80 2 52 81 3 40 60 4. 45 74 17 84 55 70 39 77 17 78 24 75 10 75 11 12 13 43 82 53 63 44 58 14 30 51 15 86 16 51 63 17 12 70 18 19 20 21 22 23 11 45 11 77 85 82 29 67 51 50 35 53 24 46 56 25 12 27 63 26 72 Using the methods discussed in lecture and the appropriate table in your textbook, what is the BEST range for thep value? O 0.005 < p« 0.01 O0.10
The Environmental Protection Agency (EPA) uses the Air Quality Index (AQI) as an Indicator of air pollution in a particular region. Higher numbers indicate increased air pollution. Suppose we collected AQI data for 26 sites in a rural region of the southeastem United States and 26 sites in an urbanized region of the southeastern US. Use the following data to test the following null hypothesis: Po: AQlrural - AQlurban Site Rural AQI Urban AQI 1 54 80 2 52 81 3 40 60 4. 45 74 17 84 55 70 39 77 17 78 24 75 10 75 11 12 13 43 82 53 63 44 58 14 30 51 15 86 16 51 63 17 12 70 18 19 20 21 22 23 11 45 11 77 85 82 29 67 51 50 35 53 24 46 56 25 12 27 63 26 72 Using the methods discussed in lecture and the appropriate table in your textbook, what is the BEST range for thep value? O 0.005 < p« 0.01 O0.10

MATLAB: An Introduction with Applications
6th Edition
ISBN:9781119256830
Author:Amos Gilat
Publisher:Amos Gilat
Chapter1: Starting With Matlab
Section: Chapter Questions
Problem 1P

Related questions
Question
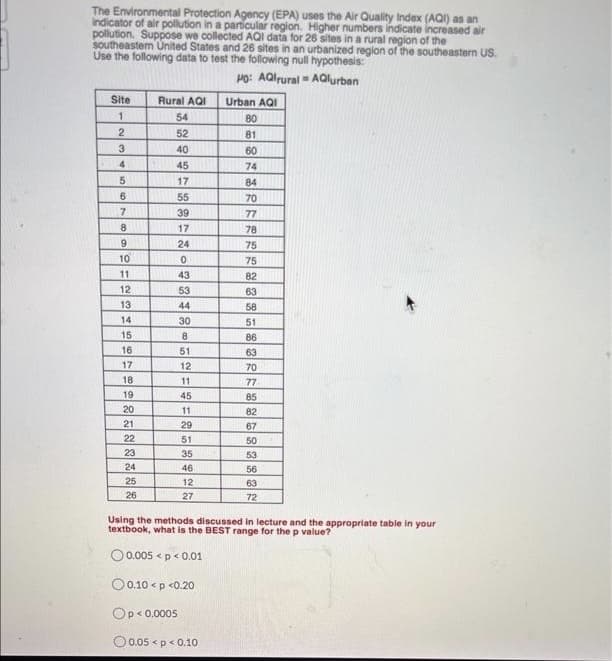
Transcribed Image Text:The Environmental Protection Agency (EPA) uses the Air Quality Index (AQI) as an
Indicator of air pollution in a particular region. Higher numbers indicate increased air
pollution. Suppose we collected AQI data for 26 sites in a rural region of the
southeastem United States and 26 sites in an urbanized region of the southeastern US.
Use the following data to test the following null hypothesis:
Po: AQlrural - AOlurban
Site
Rural AQI
Urban AQI
1
54
80
52
81
3
40
60
4
45
74
5
17
84
6.
55
70
7.
39
77
8.
17
78
9
24
75
10
75
11
43
82
12
53
63
13
44
58
14
30
51
15
16
8
86
51
12
11
63
17
70
18
77
19
45
85
20
11
82
21
29
67
22
51
50
23
35
53
24
46
56
25
12
63
26
27
72
Using the methods discussed in lecture and the appropriate table in your
textbook, what is the BEST range for the p value?
O 0.005 <p< 0.01
O0.10 < p <0.20
Op< 0.0005
O 0.05 <p< 0.10
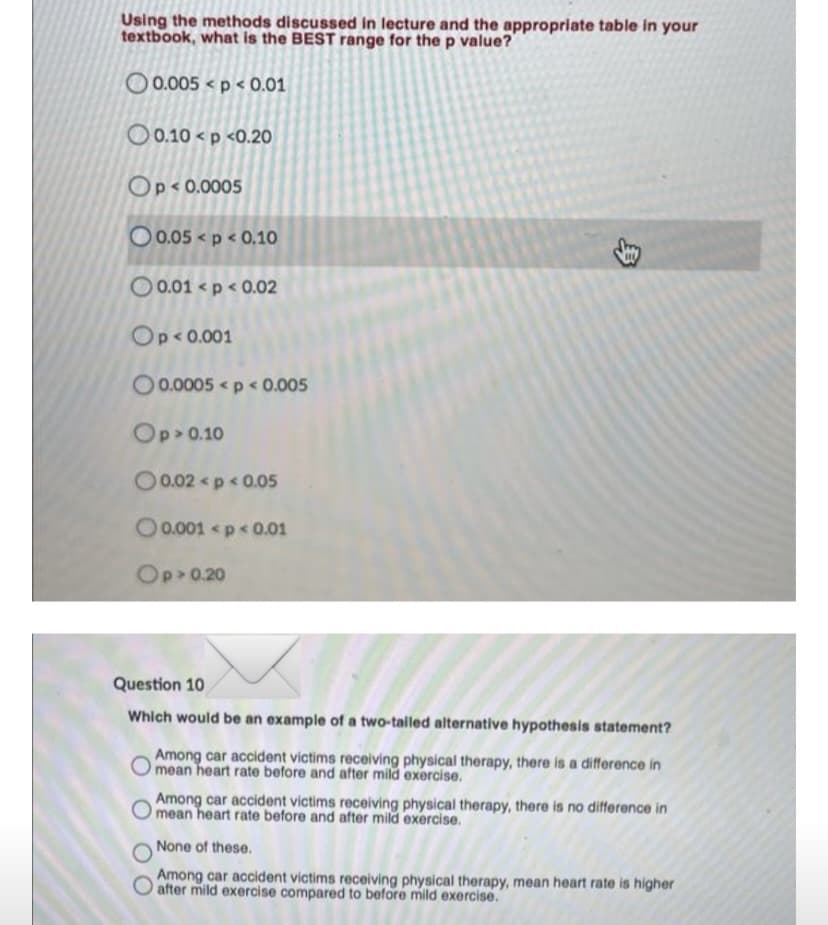
Transcribed Image Text:Using the methods discussed in lecture and the appropriate table in your
textbook, what is the BEST range for the p value?
O0.005 <p < 0.01
O 0.10 < p <0.20O
Op< 0.0005
O 0.05 < p < 0.10
O 0.01 < p < 0.02
Op<0.001
O0.0005 <p < 0.005
Op> 0.10
O0.02 p < 0.05
O0.001 <p< 0.01
Op 0.20
Question 10
Which would be an example of a two-talled alternative hypothesis statement?
Among car accident victims receiving physical therapy, there is a difference in
mean heart rate before and after mild exercise.
Among car accident victims receiving physical therapy, there is no difference in
mean heart rate before and after mild exercise.
None of these.
Among car accident victims receiving physical therapy, mean heart rate is higher
O after mild exercise compared to before mild exercise.
Expert Solution
This question has been solved!
Explore an expertly crafted, step-by-step solution for a thorough understanding of key concepts.

This is a popular solution!

Trending now
This is a popular solution!

Step by step
Solved in 3 steps with 1 images

Recommended textbooks for you
MATLAB: An Introduction with Applications
Statistics
ISBN:
9781119256830
Author:
Amos Gilat
Publisher:
John Wiley & Sons Inc

Probability and Statistics for Engineering and th…
Statistics
ISBN:
9781305251809
Author:
Jay L. Devore
Publisher:
Cengage Learning

Statistics for The Behavioral Sciences (MindTap C…
Statistics
ISBN:
9781305504912
Author:
Frederick J Gravetter, Larry B. Wallnau
Publisher:
Cengage Learning
MATLAB: An Introduction with Applications
Statistics
ISBN:
9781119256830
Author:
Amos Gilat
Publisher:
John Wiley & Sons Inc
Probability and Statistics for Engineering and th…
Statistics
ISBN:
9781305251809
Author:
Jay L. Devore
Publisher:
Cengage Learning
Statistics for The Behavioral Sciences (MindTap C…
Statistics
ISBN:
9781305504912
Author:
Frederick J Gravetter, Larry B. Wallnau
Publisher:
Cengage Learning

Elementary Statistics: Picturing the World (7th E…
Statistics
ISBN:
9780134683416
Author:
Ron Larson, Betsy Farber
Publisher:
PEARSON

The Basic Practice of Statistics
Statistics
ISBN:
9781319042578
Author:
David S. Moore, William I. Notz, Michael A. Fligner
Publisher:
W. H. Freeman

Introduction to the Practice of Statistics
Statistics
ISBN:
9781319013387
Author:
David S. Moore, George P. McCabe, Bruce A. Craig
Publisher:
W. H. Freeman