The figure at right shows the revenue and cost curves for a typical monopolistically competitive firm in the short run. a. The very elastic demand curve reflects the fact that O A. each firm produces a good for which there are no close substitutes. O B. each firm produces a good for which there are many close, but not perfect, substitutes. MC ATC OC. each firm produces a good for which there are few close substitutes. O D. None of the above. b. The profit-maximizing level of output for the firm on the diagram is D C. At the profit-maximizing level of output, profits are The area in the diagram that represents the firm's profits is MR d. Firms will V the industry until profits Output
The figure at right shows the revenue and cost curves for a typical monopolistically competitive firm in the short run. a. The very elastic demand curve reflects the fact that O A. each firm produces a good for which there are no close substitutes. O B. each firm produces a good for which there are many close, but not perfect, substitutes. MC ATC OC. each firm produces a good for which there are few close substitutes. O D. None of the above. b. The profit-maximizing level of output for the firm on the diagram is D C. At the profit-maximizing level of output, profits are The area in the diagram that represents the firm's profits is MR d. Firms will V the industry until profits Output

Chapter10: Monopolistic Competition And Oligopoly
Section: Chapter Questions
Problem 1.1P

Related questions
Question
answer c and d only
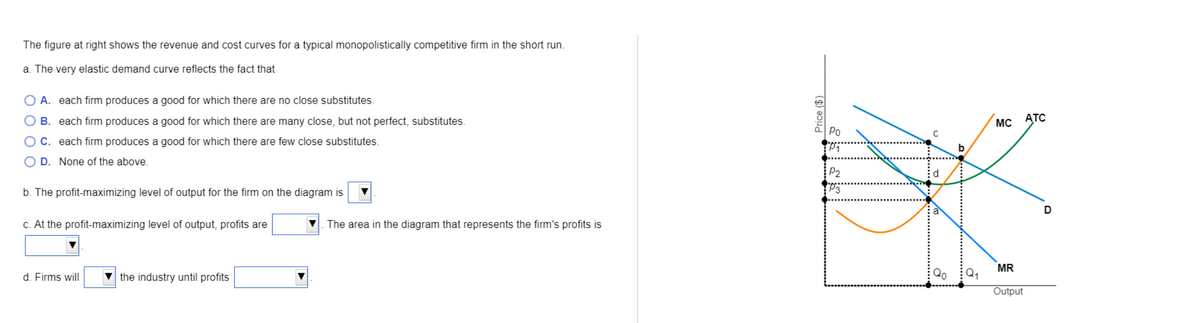
Transcribed Image Text:The figure at right shows the revenue and cost curves for a typical monopolistically competitive firm in the short run.
a. The very elastic demand curve reflects the fact that
O A. each firm produces a good for which there are no close substitutes.
O B. each firm produces a good for which there are many close, but not perfect, substitutes.
MC
АТС
Ро
C. each firm produces a good for which there are few close substitutes.
b
D. None of the above.
P2
d
b. The profit-maximizing level of output for the firm on the diagram is
c. At the profit-maximizing level of output, profits are
The area in the diagram that represents the firm's profits is
MR
d. Firms will
the industry until profits
Output
O O O O
Price ($)
Expert Solution
This question has been solved!
Explore an expertly crafted, step-by-step solution for a thorough understanding of key concepts.

This is a popular solution!

Trending now
This is a popular solution!

Step by step
Solved in 2 steps with 2 images

Knowledge Booster


Learn more about
Need a deep-dive on the concept behind this application? Look no further. Learn more about this topic, economics and related others by exploring similar questions and additional content below.Recommended textbooks for you

Exploring Economics
Economics
ISBN:
9781544336329
Author:
Robert L. Sexton
Publisher:
SAGE Publications, Inc

Principles of Economics 2e
Economics
ISBN:
9781947172364
Author:
Steven A. Greenlaw; David Shapiro
Publisher:
OpenStax
Exploring Economics
Economics
ISBN:
9781544336329
Author:
Robert L. Sexton
Publisher:
SAGE Publications, Inc
Principles of Economics 2e
Economics
ISBN:
9781947172364
Author:
Steven A. Greenlaw; David Shapiro
Publisher:
OpenStax
