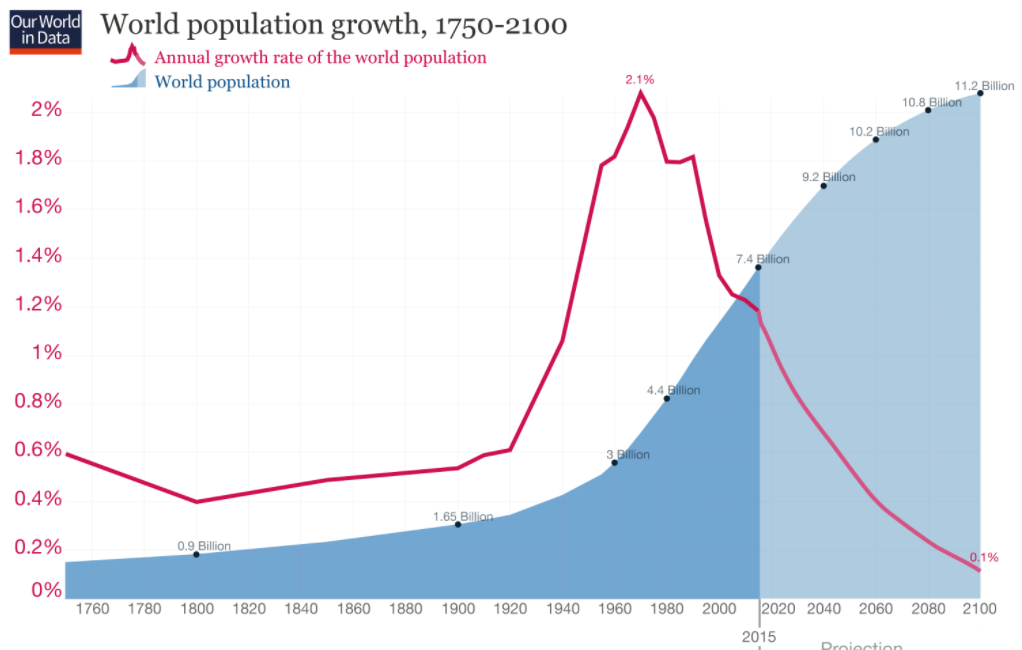
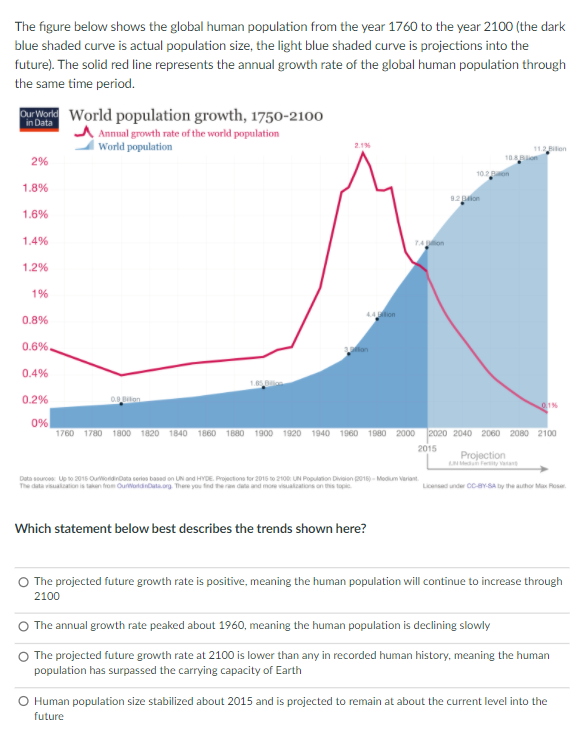
The figure below shows the global human population from the year 1760 to the year 2100 (the dark blue shaded curve is actual population size, the light blue shaded curve is projections into the future). The solid red line represents the annual growth rate of the global human population through the same time period. DurWorld World population growth, 1750-2100 Annual growth rate of the world population I World population in Data 11.2 Biton 2% 1.8% 92on 1.6% 1.4% 1.2% 1% lion 0.8% 0.6%. 0.4% 0.2% Oton 0% 1760 1780 1800 1820 1840 1860 1880 1900 1920 1940 1960 1980 2000 2020 2040 2060 2080 2100 2015 Projection dney aan Duta sources Upo 201s Oundrota series based on UN and HYDE. Proectone tor 2015 e 2100 UN Popaton Den go - Medum variant ans n fom Oudtarg There you ed e nd moaltos on s Licensd under CcevSA by the auhor Ma Rose Which statement below best describes the trends shown here? O The projected future growth rate is positive, meaning the human population will continue to increase through 2100 O The annual growth rate peaked about 1960, meaning the human population is declining slowly O The projected future growth rate at 2100 is lower than any in recorded human history, meaning the human population has surpassed the carrying capacity of Earth O Human population size stabilized about 2015 and is projected to remain at about the current level into the future
The figure below shows the global human population from the year 1760 to the year 2100 (the dark blue shaded curve is actual population size, the light blue shaded curve is projections into the future). The solid red line represents the annual growth rate of the global human population through the same time period. DurWorld World population growth, 1750-2100 Annual growth rate of the world population I World population in Data 11.2 Biton 2% 1.8% 92on 1.6% 1.4% 1.2% 1% lion 0.8% 0.6%. 0.4% 0.2% Oton 0% 1760 1780 1800 1820 1840 1860 1880 1900 1920 1940 1960 1980 2000 2020 2040 2060 2080 2100 2015 Projection dney aan Duta sources Upo 201s Oundrota series based on UN and HYDE. Proectone tor 2015 e 2100 UN Popaton Den go - Medum variant ans n fom Oudtarg There you ed e nd moaltos on s Licensd under CcevSA by the auhor Ma Rose Which statement below best describes the trends shown here? O The projected future growth rate is positive, meaning the human population will continue to increase through 2100 O The annual growth rate peaked about 1960, meaning the human population is declining slowly O The projected future growth rate at 2100 is lower than any in recorded human history, meaning the human population has surpassed the carrying capacity of Earth O Human population size stabilized about 2015 and is projected to remain at about the current level into the future

Biology (MindTap Course List)
11th Edition
ISBN:9781337392938
Author:Eldra Solomon, Charles Martin, Diana W. Martin, Linda R. Berg
Publisher:Eldra Solomon, Charles Martin, Diana W. Martin, Linda R. Berg
Chapter53: Introduction To Ecology: Population Ecology
Section: Chapter Questions
Problem 5TYU: In a graph of population size versus time, a J-shaped curve is characteristic of (a) exponential...

Related questions

Question
Need help with the following question
Transcribed Image Text:Our World World population growth, 1750-2100
in Data
Annual growth rate of the world population
World population
2.1%
11.2 Billion
10.8 Billion
2%
10.2 Billion
1.8%
9.2 Billion
1.6%
1.4%
7.4 Billion
1.2%
1%
4.4 Billion
0.8%
0.6%
3 Billion
0.4%
1.65 Billion
0.2%
0.9 Billion
0.1%
0%
1760
1780
1800
1820
1840
1860
1880
1900
1920
1940
1960
1980
2000
2020 2040
2060 2080 2100
2015
Drojection
Transcribed Image Text:The figure below shows the global human population from the year 1760 to the year 2100 (the dark
blue shaded curve is actual population size, the light blue shaded curve is projections into the
future). The solid red line represents the annual growth rate of the global human population through
the same time period.
DurWorld World population growth, 1750-2100
Annual growth rate of the world population
I World population
in Data
2.1%
11.2 Bilon
10.8Ron
2%
102 Bon
1.8%
92 on
1.6%
1.4%
TAion
1.2%
1%
4ion
0.8%
0.6%
0.4%
0.2%
0iton
0%
1760 1780 1800 1820 1840 1860 1880 1900 1920 1940 1960 1980 2000 2020 2040 2060 2080 2100
2015
Projection
NMdun Feity vaan
Data sources Up to 2015 Ourondroata series based on UN and HYDE. Projectona for 2015 to 2100: UN Popuation Dvision g016) - Modium variant.
The data vualation is takan from OurortdrCata.org There you fed heran data and more visualzations on this tapie
Licensad under Ccev-SA by the auhor Max Roser.
Which statement below best describes the trends shown here?
O The projected future growth rate is positive, meaning the human population will continue to increase through
2100
O The annual growth rate peaked about 1960, meaning the human population is declining slowly
O The projected future growth rate at 2100 is lower than any in recorded human history, meaning the human
population has surpassed the carrying capacity of Earth
O Human population size stabilized about 2015 and is projected to remain at about the current level into the
future
Expert Solution
This question has been solved!
Explore an expertly crafted, step-by-step solution for a thorough understanding of key concepts.

This is a popular solution!

Trending now
This is a popular solution!

Step by step
Solved in 2 steps

Knowledge Booster


Learn more about
Need a deep-dive on the concept behind this application? Look no further. Learn more about this topic, biology and related others by exploring similar questions and additional content below.Recommended textbooks for you
Biology (MindTap Course List)
Biology
ISBN:
9781337392938
Author:
Eldra Solomon, Charles Martin, Diana W. Martin, Linda R. Berg
Publisher:
Cengage Learning

Biology Today and Tomorrow without Physiology (Mi…
Biology
ISBN:
9781305117396
Author:
Cecie Starr, Christine Evers, Lisa Starr
Publisher:
Cengage Learning
Biology (MindTap Course List)
Biology
ISBN:
9781337392938
Author:
Eldra Solomon, Charles Martin, Diana W. Martin, Linda R. Berg
Publisher:
Cengage Learning
Biology Today and Tomorrow without Physiology (Mi…
Biology
ISBN:
9781305117396
Author:
Cecie Starr, Christine Evers, Lisa Starr
Publisher:
Cengage Learning