The figure shows the graph of the results of 500 samples of size 30 in which the proportion of articles that passed a quality review was measured. Consider these (empirical) results in relation to an approximation based on the Central Limit Theorem (TCL) under the assumption that the population proportion of articles that satisfy the quality test is 0.7. Check the correct expressions. 040 0.30 025 f relativ 020- 015 00s 0.32 0.40 0.48 0.56 064 0.72 0.80 Value of p Empirical data indicate that the population proportion of articles that satisfy the quality test should be less than 0.7 The Central Limit Theorem is not applicable in this case In the empirical distribution, a probability that less than 48% of articles are registered in a sample fulfilling the quality test is lower than that indicated by the TCL approximation. The approximation through the TCL indicates that the probability of observing more than 72% of articles satisfying the quality test is much higher than that obtained empirically.
The figure shows the graph of the results of 500 samples of size 30 in which the proportion of articles that passed a quality review was measured. Consider these (empirical) results in relation to an approximation based on the Central Limit Theorem (TCL) under the assumption that the population proportion of articles that satisfy the quality test is 0.7. Check the correct expressions. 040 0.30 025 f relativ 020- 015 00s 0.32 0.40 0.48 0.56 064 0.72 0.80 Value of p Empirical data indicate that the population proportion of articles that satisfy the quality test should be less than 0.7 The Central Limit Theorem is not applicable in this case In the empirical distribution, a probability that less than 48% of articles are registered in a sample fulfilling the quality test is lower than that indicated by the TCL approximation. The approximation through the TCL indicates that the probability of observing more than 72% of articles satisfying the quality test is much higher than that obtained empirically.

MATLAB: An Introduction with Applications
6th Edition
ISBN:9781119256830
Author:Amos Gilat
Publisher:Amos Gilat
Chapter1: Starting With Matlab
Section: Chapter Questions
Problem 1P

Related questions

Question
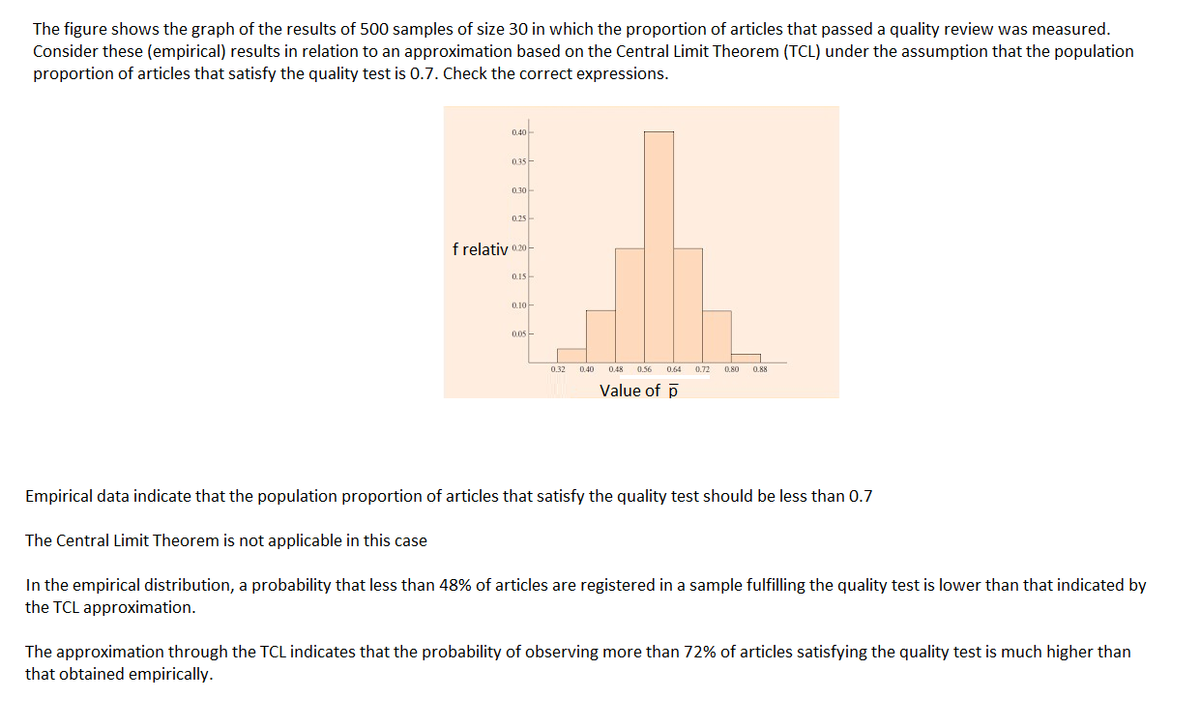
Transcribed Image Text:The figure shows the graph of the results of 500 samples of size 30 in which the proportion of articles that passed a quality review was measured.
Consider these (empirical) results in relation to an approximation based on the Central Limit Theorem (TCL) under the assumption that the population
proportion of articles that satisfy the quality test is 0.7. Check the correct expressions.
0.40
0.35
0.30-
f relativ 0.20-
0.15
0.10-
0.05-
0.32
0.48
0.56
0.64
0.72
0.80
0.88
Value of p
Empirical data indicate that the population proportion of articles that satisfy the quality test should be less than 0.7
The Central Limit Theorem is not applicable in this case
In the empirical distribution, a probability that less than 48% of articles are registered in a sample fulfilling the quality test is lower than that indicated by
the TCL approximation.
The approximation through the TCL indicates that the probability of observing more than 72% of articles satisfying the quality test is much higher than
that obtained empirically.
Expert Solution
This question has been solved!
Explore an expertly crafted, step-by-step solution for a thorough understanding of key concepts.

Step by step
Solved in 2 steps

Knowledge Booster


Learn more about
Need a deep-dive on the concept behind this application? Look no further. Learn more about this topic, statistics and related others by exploring similar questions and additional content below.Recommended textbooks for you
MATLAB: An Introduction with Applications
Statistics
ISBN:
9781119256830
Author:
Amos Gilat
Publisher:
John Wiley & Sons Inc

Probability and Statistics for Engineering and th…
Statistics
ISBN:
9781305251809
Author:
Jay L. Devore
Publisher:
Cengage Learning

Statistics for The Behavioral Sciences (MindTap C…
Statistics
ISBN:
9781305504912
Author:
Frederick J Gravetter, Larry B. Wallnau
Publisher:
Cengage Learning
MATLAB: An Introduction with Applications
Statistics
ISBN:
9781119256830
Author:
Amos Gilat
Publisher:
John Wiley & Sons Inc
Probability and Statistics for Engineering and th…
Statistics
ISBN:
9781305251809
Author:
Jay L. Devore
Publisher:
Cengage Learning
Statistics for The Behavioral Sciences (MindTap C…
Statistics
ISBN:
9781305504912
Author:
Frederick J Gravetter, Larry B. Wallnau
Publisher:
Cengage Learning

Elementary Statistics: Picturing the World (7th E…
Statistics
ISBN:
9780134683416
Author:
Ron Larson, Betsy Farber
Publisher:
PEARSON

The Basic Practice of Statistics
Statistics
ISBN:
9781319042578
Author:
David S. Moore, William I. Notz, Michael A. Fligner
Publisher:
W. H. Freeman

Introduction to the Practice of Statistics
Statistics
ISBN:
9781319013387
Author:
David S. Moore, George P. McCabe, Bruce A. Craig
Publisher:
W. H. Freeman