The figure shows the marginal social cost and marginal social benefit curves for a chemical producing firm operating upstream from a hatchery. Which of the following is true according to the Coase Theorem? MSC, MSB ($/ton) 100 MSC 90 80 A 7아 60 50- 40 3아 2아 MSB 10- 6. 6. 10 Quantity of Emissions (tons per day)
The figure shows the marginal social cost and marginal social benefit curves for a chemical producing firm operating upstream from a hatchery. Which of the following is true according to the Coase Theorem? MSC, MSB ($/ton) 100 MSC 90 80 A 7아 60 50- 40 3아 2아 MSB 10- 6. 6. 10 Quantity of Emissions (tons per day)

Chapter14: Environmental Economics
Section: Chapter Questions
Problem 7SQ

Related questions
Question
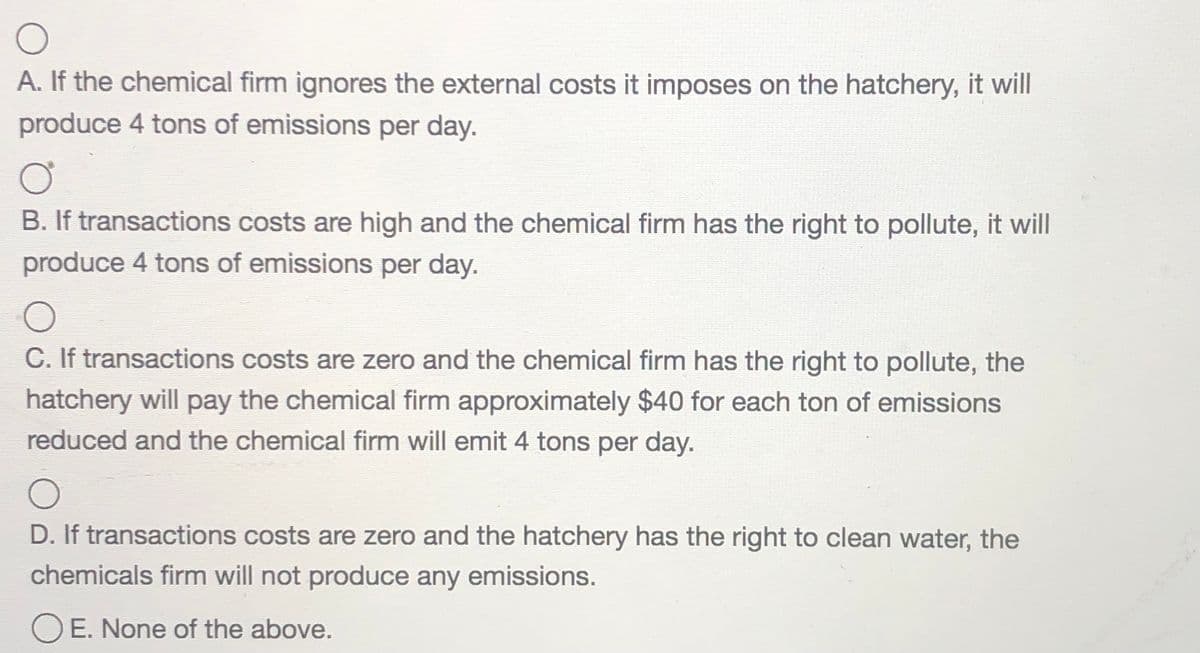
Transcribed Image Text:A. If the chemical firm ignores the external costs it imposes on the hatchery, it will
produce 4 tons of emissions per day.
B. If transactions costs are high and the chemical firm has the right to pollute, it will
produce 4 tons of emissions per day.
C. If transactions costs are zero and the chemical firm has the right to pollute, the
hatchery will pay the chemical firm approximately $40 for each ton of emissions
reduced and the chemical firm will emit 4 tons per day.
D. If transactions costs are zero and the hatchery has the right to clean water, the
chemicals firm will not produce any emissions.
O E. None of the above.
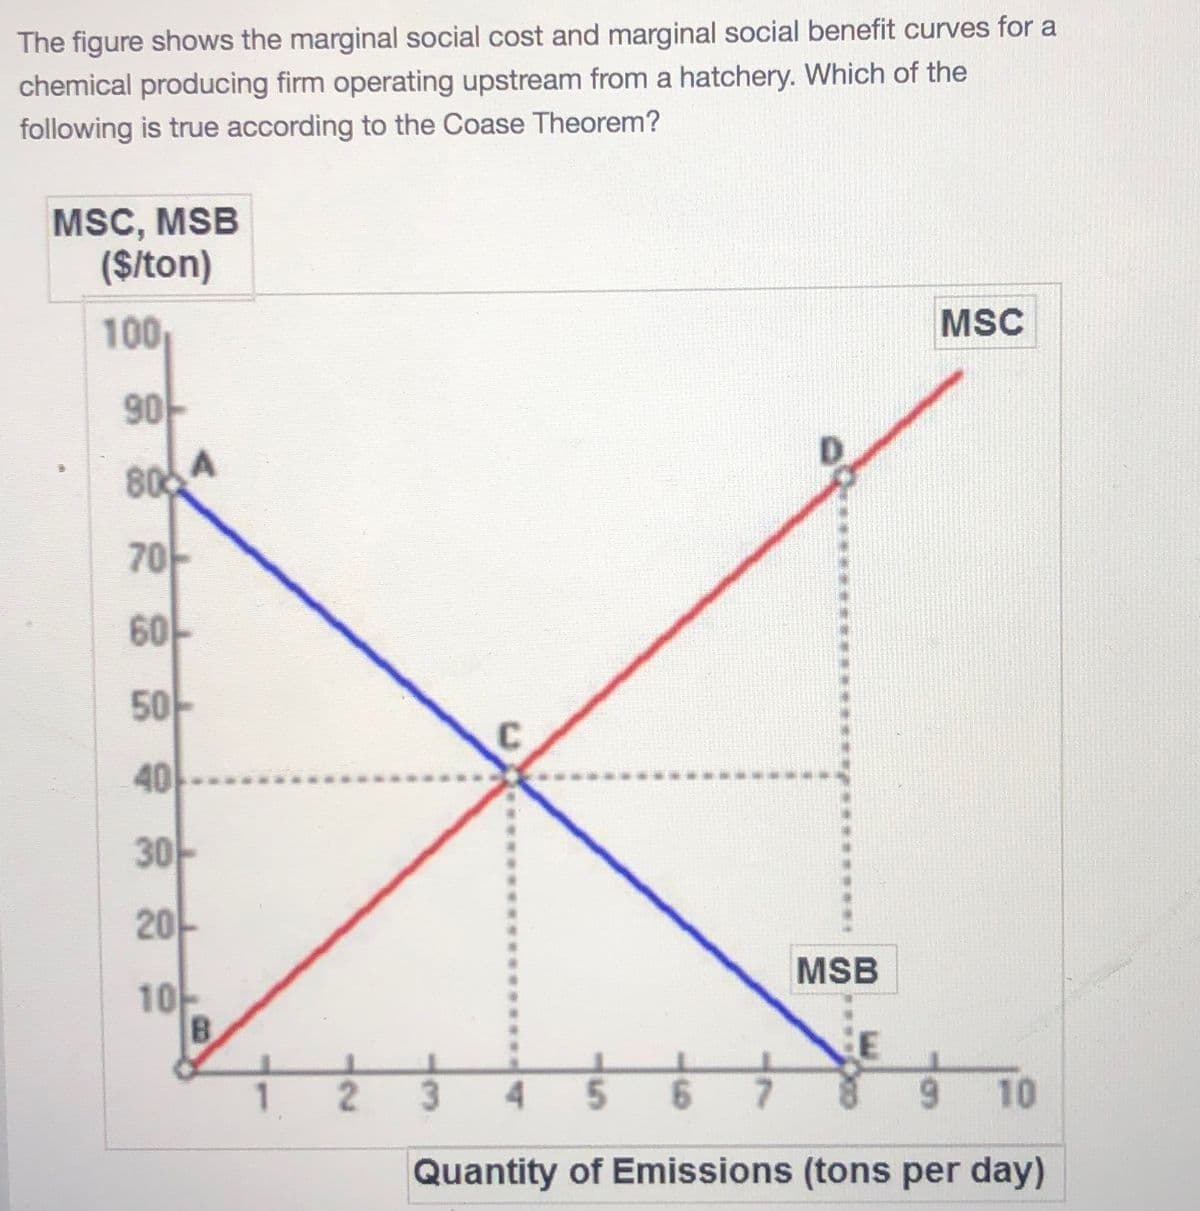
Transcribed Image Text:The figure shows the marginal social cost and marginal social benefit curves for a
chemical producing firm operating upstream from a hatchery. Which of the
following is true according to the Coase Theorem?
MSC, MSB
($/ton)
100
MSC
90
806A
70
60
50
40
3아
20-
MSB
10
B.
5.
7.
10
Quantity of Emissions (tons per day)
***
Expert Solution
This question has been solved!
Explore an expertly crafted, step-by-step solution for a thorough understanding of key concepts.

This is a popular solution!

Trending now
This is a popular solution!

Step by step
Solved in 2 steps

Knowledge Booster


Learn more about
Need a deep-dive on the concept behind this application? Look no further. Learn more about this topic, economics and related others by exploring similar questions and additional content below.Recommended textbooks for you


Principles of Economics 2e
Economics
ISBN:
9781947172364
Author:
Steven A. Greenlaw; David Shapiro
Publisher:
OpenStax
Principles of Economics 2e
Economics
ISBN:
9781947172364
Author:
Steven A. Greenlaw; David Shapiro
Publisher:
OpenStax

Principles of Economics, 7th Edition (MindTap Cou…
Economics
ISBN:
9781285165875
Author:
N. Gregory Mankiw
Publisher:
Cengage Learning

Essentials of Economics (MindTap Course List)
Economics
ISBN:
9781337091992
Author:
N. Gregory Mankiw
Publisher:
Cengage Learning

Principles of Economics (MindTap Course List)
Economics
ISBN:
9781305585126
Author:
N. Gregory Mankiw
Publisher:
Cengage Learning