The Moon Illusion refers, roughly speaking, to the common exxperience that the moon appears larger (and closer to us) when it is near the horizon than whenit is at its zenith. Wishing to investigate the causes of the illusion (which are still debated), we have designed an experiment in which participants must acjust the diameter of a variable circular light placed at eye level to match the diameter of a fixed circular light placed well above eye level. (See, for example, Kaufman, L & Rock, I. (1989). The moon llusion thirty years later," chapter 8 in M. Hershenson (Ed.) The Moon lusion, Hlsdale, NI: L Earibaum.) We have tested 25 participants and recorded for each participant her experimental "adjustable fxed ratio." Our data are summarized in the following histocra: Frequency Adjustable fixed ratio Based on the histogram, draw the ogive (the cumulative relative frequency polygon) for our cata. Cumlative relative frequency 04 02 02 04 0.6 Adjustable fixod ratio
The Moon Illusion refers, roughly speaking, to the common exxperience that the moon appears larger (and closer to us) when it is near the horizon than whenit is at its zenith. Wishing to investigate the causes of the illusion (which are still debated), we have designed an experiment in which participants must acjust the diameter of a variable circular light placed at eye level to match the diameter of a fixed circular light placed well above eye level. (See, for example, Kaufman, L & Rock, I. (1989). The moon llusion thirty years later," chapter 8 in M. Hershenson (Ed.) The Moon lusion, Hlsdale, NI: L Earibaum.) We have tested 25 participants and recorded for each participant her experimental "adjustable fxed ratio." Our data are summarized in the following histocra: Frequency Adjustable fixed ratio Based on the histogram, draw the ogive (the cumulative relative frequency polygon) for our cata. Cumlative relative frequency 04 02 02 04 0.6 Adjustable fixod ratio

Mathematics For Machine Technology
8th Edition
ISBN:9781337798310
Author:Peterson, John.
Publisher:Peterson, John.
Chapter31: Customary Vernier Calipers And Height Gages
Section: Chapter Questions
Problem 16A: The tables for Exercises 15 and 16 give the position of the zero graduation on the vernier scale in...

Related questions
Question
Transcribed Image Text:Eapatel
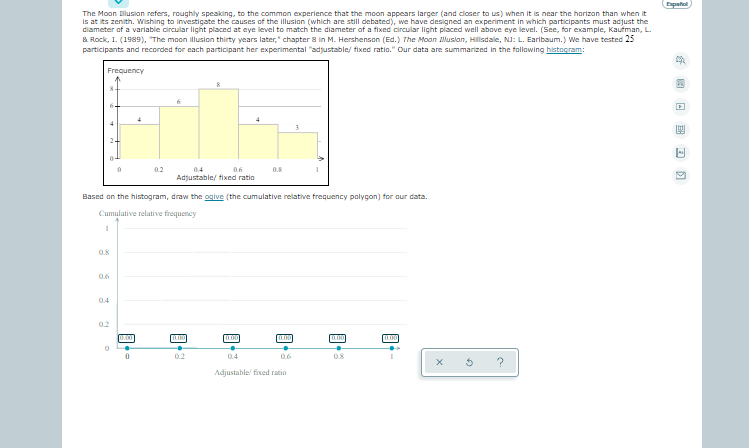
The Moon Illusion refers, roughly speaking, to the common experience that the moon appears larger (and closer to us) when it is near the horizon than when it
is at its zenith. Wishing to investiçate the causes of the illusion (which are still debated), we have designed an experiment in which participants must adjust the
diameter of a variable circular light placed at eye level to match the diameter of a fixed circular light placed well above eye level. (See, for example, Kaufman, L.
& Rock, 1. (1989), The moon illusion thirty years later," chapter 8 in M. Hershenson (Ed.) The Moon Musion, Hillsdale, NJ: L. Earlbaum.) We have tested 25
participants and recorded for each participant her experimental "adjustable/ fixed ratio." Our data are summarized in the follawing histogram:
Frequency
国
02
0.4
0.6
0.8
Adjustable/ fixed ratio
Based on the histogram, draw the ogive (the cumulative relative frequency polygon) for aur data.
Cumulative relative frequency
08
0.6
0.4
02
0.00
0.00
0.2
04
0.6
0.8
Adjustahle fixed ratio
目+
Expert Solution
This question has been solved!
Explore an expertly crafted, step-by-step solution for a thorough understanding of key concepts.

This is a popular solution!

Trending now
This is a popular solution!

Step by step
Solved in 2 steps with 1 images

Recommended textbooks for you
Mathematics For Machine Technology
Advanced Math
ISBN:
9781337798310
Author:
Peterson, John.
Publisher:
Cengage Learning,

Trigonometry (MindTap Course List)
Trigonometry
ISBN:
9781305652224
Author:
Charles P. McKeague, Mark D. Turner
Publisher:
Cengage Learning
Mathematics For Machine Technology
Advanced Math
ISBN:
9781337798310
Author:
Peterson, John.
Publisher:
Cengage Learning,
Trigonometry (MindTap Course List)
Trigonometry
ISBN:
9781305652224
Author:
Charles P. McKeague, Mark D. Turner
Publisher:
Cengage Learning