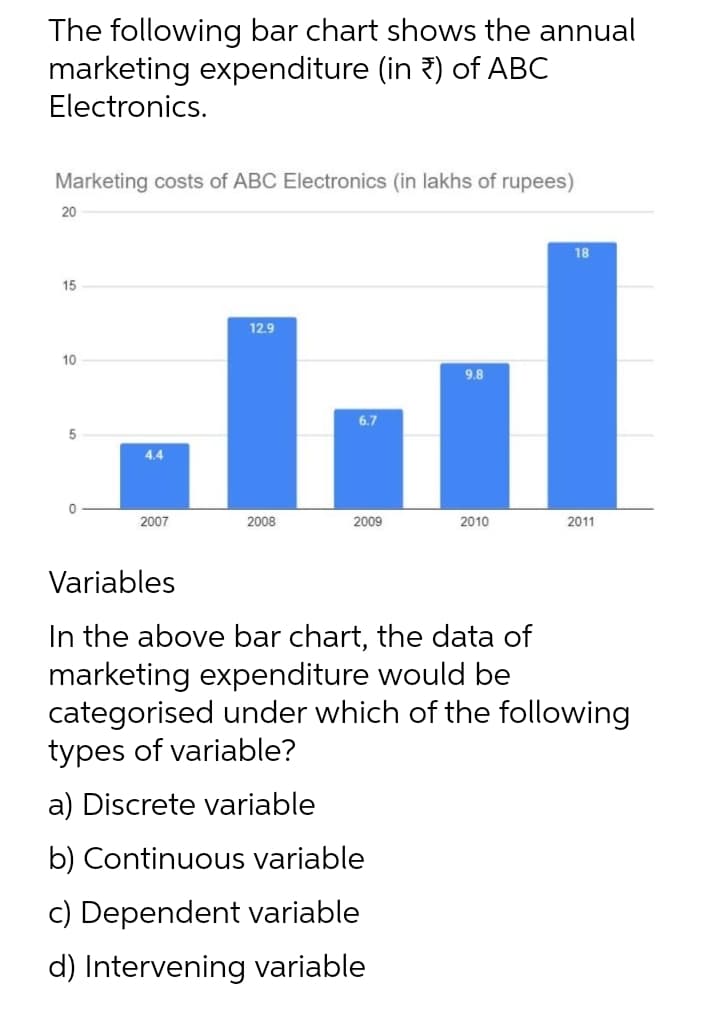
The following bar chart shows the annual marketing expenditure (in ?) of ABC Electronics. Marketing costs of ABC Electronics (in lakhs of rupees) 20 18 15 12.9 10 9.8 6.7 4.4 2007 2008 2009 2010 2011 Variables In the above bar chart, the data of marketing expenditure would be categorised under which of the following types of variable? 5.


Q: Use the following data to calculate the information below
A: We know Elasticity of demand can be calculated as : 1. Percentage Method = -∆Q∆P* PQ…
Q: The Xhang Corporation operates five clothing suppliers in China to provide merchandise for Nike.…
A: weightage mean = Σ WX / ΣW
Q: The slope for this graph is:
A: The slope of a line generally measures the rate of change of the variable in one axis to a change in…
Q: 11.2.44 Differentiate the function. y=x -5x dy %3D dx 6,
A: Given information:
Q: The table gives information about the relationship between two variables, x and y. The…
A: The relationship between x and y can be positive, negative or remains constant depends on the values…
Q: C= 150 + 0.85Y I= 350 Use the expenditure method to calculate the country's equilbruim income and…
A: Given information: C= 150 + 0.85Y I= 350 Where, Y - income, C - consumption I - investment…
Q: Write the equations of the vertical and horizontal lines through the point (- 1.8, - 3.6). The…
A: The equation of any vertical line is such that the value of x is fixed, while it can take any value…
Q: 100 80 60 Exam score (points) 40 20 0 2 4 6 8 Study time (hours) 10 QUESTION 1: (i) (ii) (iii)…
A: Study Time (X) Exam score (y) 2 30 4 50
Q: Question 4: The following data represent the distribution of temperature in (ºC) of one city during…
A: From the given set of data, the frequency distribution table is computed below:
Q: 100 80 60 40 20 O 40 80 120 160 200 Refer to the diagram. The equation that shows the relationship…
A: "Since you have asked multiple questions, we will solve first question for you .. If you want any…
Q: Type of Rubber Type of tyre T2 T3 Availability of Rubber (in tons) T1 R1 310 R2 2 2 3 180 R3 4 3 2…
A:
Q: here is a negative relationship between two variables if: they move in opposite directions. they…
A: Different variables have different sorts of relations between them. This relationship can be…
Q: An automobile tire manufacturer collected the data in the table relating tire pressure x (in pounds…
A: Answer: Given, x Mileage f(x) 28 43 44 30 51 51.9 32 56 55.1 34 50 53.5 36 47 47.3…
Q: Real-Time Data Analysis Exercise The following table contains data for nominal GDP. real GDP, and…
A: The GDP (gross domestic product) price deflator estimates changes in the prices of all the goods and…
Q: According to the following given information how to determine: Production 1 2 3 4 5 6 7 8 9 10 11 12…
A: Introduction We have given data of a product Z. Product Z has produced 1 to 15 months as units of…
Q: Solve the following equation for x, where x represents a real number. X3D0.56х — 1.32 X = (Type an…
A: Given equation: x=0.56x-1.32 Taking x terms to the left-hand side x-0.56x=-1.32
Q: We have estimated the impact of gross domestic product (GDP), energy consumption (ENERGY) and…
A: Since you have asked multiple questions, we will solve the first-three sub-parts for you. If you…
Q: A tax on gasoline is proposed in order to raise money for the pollution-control activities of…
A:
Q: Differentiate between Procyclical Variables and Countercyclical Variables. Also give at least 02…
A: Economics: It refers to the field in which the study of resources that are scarce and the unlimited…
Q: 2) Solve the following equations for X without using logarithms Za) 22x = 16 - 27 *-X - 2 2 2c) In
A: 2a) 22x=16 16 can be written in exponent form with base 2 : 24 22x=24 One of the rule of exponents…
Q: Suppose the relationship between the government's tax revenue (T) and national income (Y) is…
A: Given T=30+0.5Y so here slope is 0.5 we can draw the graph of the equation which are as follow-
Q: a) direct relationship. b) positive relationship. c) obsolete relationship d) negative…
A: please find the correct answer below.
Q: A zero slope shows: positive relationship between two variables no relationship between two…
A: The slope reflects the relationship between two variables that can be graphically represented as…
Q: Construct a table from the data shown on the graph below. Which is the dependent variable and which…
A: The independent variable is the one that changes and can have a direct effect on the dependent…
Q: Compute for the slope based on the illustrated results. What is the implication of the result?
A: Given Price of Pokémon card = $14 Price of stickers = $7 Pokemon is taken on x-axis and sticker is…
Q: 40) In the above figure, a negative relationship is demonstrated in which of the graphs? A) Figure A…
A: Relationship of two variables in a graph depends on slope of the line. If graph is upward sloping…
Q: Write the equations of the vertical and horizontal lines through the point (- 1.3, - 3.7). The…
A: For the Horizontal or Vertical Line, the slope of the equation (generally represented by m) is zero.…
Q: 100 80 60 Exam score (points) 40 20 0 2 4 6 8 10 Study time (hours) QUESTION 1: (1) Construct a…
A: The graph given in the question depict the linear relationship between "Study Time" and "Exam Score"…
Q: 40. The following are the prices of commodities in 2016 and 2017. Calculate a price index based on…
A: In the question above, it is given the prices of commodities in year 2016 and 2017. We have…
Q: Suppose the relationship between the government's tax revenue (T) and national income (Y) is…
A: Given the equation that shows the relationship between the tax revenue and national income. T = 10 +…
Q: Call centers today play an important role in managing day-to-day business communications with…
A: The histogram is showing percentage on the Y-axis and the seconds on the X-axis.
Q: (A) Phoenix Lumber Company uses the number of construction permits issued to help estimate demand…
A: a) The dependent variable would be: (Y) that is Sales The independent variable would be: (X) that is…
Q: $1,900 D $1,000; $1,000 $1,200: $1,000 $1,000; $1,200 $1,000 $1,800 g the data given in the table…
A: WHAT IS GDP DEFLATOR? GDP Deflator is also called as GDP Price Deflator or Implicit Price Deflator.…
Q: This graph shows the seasonal factor taken out of the series after performing the decomposition.…
A: In the given graph, the data is centered at 0 to make it consistent. This is because of the reason…
Q: Greenhouse gases trap heat and make the planet warmer. Human activities are responsible for almost…
A: The measure that depicts different slices for illustration of a numerical proportion of various…
Q: 0.997738 Coefficient Intercept Interest Rate -1.61538 14.88462 1. Are there factors other than…
A: Regression analysis is a powerful statistical method that allows you to examine the relationship…
Q: 1.) What is the statistical technique for finding the best relationship between dependent variable…
A: Hi! Thank you for the question, As per the honor code, we are allowed to answer one question at a…
Q: Give an analysis of Elephant Chart by Branko Milanovic.
A: The Elephant Curve, also known as the Lakner-Milanovic graph or the global growth incidence curve,…
Q: Erin grows pecans. The number of bushels (B) that she can produce depends on the number of inches of…
A: A function represents a rule that is able to assign a number in R1 to each number in R1 for example…
Q: What type of relationship would you expect between the following? a. Sales of hot dogs and sales of…
A: The relationship between two variables refers to the way the variables change and tend to react upon…
Q: Use the following STATA output to test whether the variable wgt is significant at 5% level: Source |…
A: Answer- Need to find- Weather the variable is significant at 5% level Evaluate the options:- 1.…
Q: The given table shows the percentage of emails that are sent each day of the business week according…
A: Below is the given data: Monday = 15% Tuesday = 23% Wednesday = 22% Thursday = 21% Friday = 19%
Q: From the following data relating to the number of letters posted a port office find the seasonal…
A: In the mentioned question we have to calculate seasonal variations using the method of simple…
Q: What is the slope of the line to the equation P=30−1/2Q?
A: Answer: Given, P=30-12Q To find the slope of the above line let us differentiate the above function…
Q: C= 150 + 0.85Y I= 530 Use the expenditure method to calculate the country's equilbruim income and…
A: In the expenditure method, to calculate the GDP of the country, the consumption expenditure,…


Trending now
This is a popular solution!

Step by step
Solved in 2 steps

- A firm keeps a record of sales and prices over the past seven months, resulting in the following table: Price (ZMW/ton) Sales (tons) Nov. 1985 7.5 84.5 Dec. 8.0 82.0 Jan. 1986 8.0 84.0 Feb. 7.2 92.0 March 7.0 95.0 April 8.0 92.0 May 8.5 91.5 Use these observations to estimate demand as a linear function of both price and time. Further, utilise this function to estimate demand for the following month, on the assumption that: (a) price remains unchanged, (b) price increases to ZMW9/ton. Hence estimate the price elasticity of demand between these prices and find the price which would maximise sales revenue. Given the nature of the observations, comment on any difficulties in interpreting your results for decision-making purposes.Imagine that you work for the maker of a leading brand of low-calorie, frozen microwavable food that estimates the following demand equation for its product using data from 26 supermarkets around the country for the month of April. Note: The following is a regression equation. Standard errors are in parentheses for the demand for widgets. QD = - 5200 - 42P + 20PX + 5.2I + 0.20A + 0.25M (2.002) (17.5) (6.2) (2.5) (0.09) (0.21) R2 = 0.55 n = 26 F = 4.88 Your supervisor has asked you to compute the elasticities for each independent variable. Assume the following values for the independent variables: Q = Quantity demanded of 3-pack units P (in cents) = Price of the product = 500 cents per 3-pack unit PX (in cents) = Price of leading competitor's product = 600 cents per 3-pack unit I (in dollars) = Per capita income of the standard metropolitan statistical area (SMSA) in…Ypsilanti Market Research conducted a survey to find out whether people who earn more money purchase more expensive goods. The following graph indicates the relationship between income the survey subjects earned and the price of the car that they purchased. The variable shown on the vertical axis is __________ (options: thousands of dollars per car, thousands of dollars per year, income, thousands of dollars, price, number of goods). The units for the variable on the horizontal axis are _________ (options: thousands of dollars per car, thousands of dollars per year, income, thousands of dollars, price, number of goods). There are two ways to view the information presented on the graph. First, the graph tells us the amount a person with a certain income is likely to spend on a car, and second, it tells us the probable income of a person who spent a certain amount on a car. For example, if an individual earned $50,000 last year and purchased a new car, you would expect that person to…
- part a b and c solved Suppose that a coffee producing firm estimated the following regression of thedemand for its brand of coffee:Qc = 1.5 − 3.0Pc + 0.8Y + 2.0Pb − 0.6PS +1.2 Awhere Qc = sales of coffee brand C, in dollarsper pound Pc = price of coffee brand C,in dollars per poundY = personal disposable income, in millions of dollars per yearPb = price of the competitive brand of coffee, in dollarsper pound Ps = price of sugar, in dollars per poundA = advertising expenditures for coffee brand C, in hundreds of thousands ofdollars per year.Suppose also that this year, Pc = $2, Y = $2.5, Pb = $1.80,Ps = $1 and A =$1.a. Interpret the results of the estimated demand.b. Compute point price elasticity of demand for the firm’s brand of coffeewith respect to its price.c. Compute the cross-price elasticity of demand for coffee with respect to theprice of competitive coffee brand b.d. At the current price level, would it be viable for the firm to increase the pricelevel of its brand of coffee?…Please find the effect of Y and r if there is a decrease in the tax rate. Use the following equations and evaluate the total derivative.It is known that the ABC oil company supplies consumers with 150 tons of products per day. The company produces only two types of products - gasoline and diesel fuel. The limiting transformation ratio of diesel fuel relative to gasoline is 0.5. a) Draw a line of the company's monthly production capacity for gasoline and diesel. b) With the advent of new technologies, production increased by 20%, and the availability of gasoline increased by 30%. Explain how the company's new product line differs from the previous one. c) If we put the gasoline production on the X-axis of the graph, what percentage of the slope capacity of the production line is different from the slope ratio of the previous production line?
- A first year student estimated a linear consumption function and found out that Ct = 200 + 0.65Yc + 0.25 Ct t-1. Give economic interpretation of the above result, clearly explaining the meaning of the intercept, variables and the coefficients.The demand function for apples is the following. Qn = 10 – Pn + 0.2Y +0.5 Pc – 2Ps + 0.2A Where: Qn = annual sales of apples (millions of kilos) Pn = price of apples (£1 per kilo) Y = disposable income in the UK £trillions (£10 trillions) Pc = price of a pies £ per kilo (£2 per kilo) Ps = price of pear (£2 per kilo) A = advertising measured in hundreds of thousands of £5 (use as 5 in your calculations) What is the own price elasticity of demand and what kind of product apple is? a. -1/9, inelastic. b. 1/9, inelastic. c. -2, inelastic. d. -0.5, elastic. e. All the other answers are wrong.Colton is trying to figure out when two buses traveling at different speeds will pass one another. The buses are traveling in the same direction and begin 3 miles apart. He has defined variable tt as follows: Let tt represent the time in hours. Is this a good variable definition? YES OR NO ? IF NO than explain why?
- The demand function for apples is the following. Qn = 10 – Pn + 0.2Y +0.5 Pc – 2Ps + 0.2A Where: Qn = annual sales of apples (millions of kilos) Pn = price of apples (£1 per kilo) Y = disposable income in the UK £trillions (£10 trillions) Pc = price of a pies £ per kilo (£2 per kilo) Ps = price of pear (£2 per kilo) A = advertising measured in hundreds of thousands of £5 (use as 5 in your calculations) What direction should the apple producers move the price if they wanted to maximize their revenue? a. There is not enough information. b. Don't change the price. c. Cut the price. d. Raise the price.The variable shown on the vertical axis is _________ . The units for the variable on the horizontal axis are __________ . There are two ways to view the information presented on the graph. First, the graph tells us the amount a person with a certain income is likely to spend on a car, and second, it tells us the probable income of a person who spent a certain amount on a car. For example, if an individual earned $40,000 last year and purchased a new car, you would expect that person to have paid about _________ for the car. Similarly, if someone just paid $25,000 for a car, you could use this graph to estimate that this person's income was probably around __________ .AD has estimated the following demand relationship for its product over the last four years, using monthly observations: ln Qt = 4.932- 1.238 ln Pt + 1.524 ln Yt-1 + 0.4865lnQt-1(2.54) (1.38) (3.65) (2.87)R2= 0.8738where Q = sales in units, P = price in Rs., Y is income in Rs,000, and the numbers in brackets are t-statistics.a. Interpret the above model.b. Make a sales forecast if price is Rs. 9, income last month was Rs. 25,000 and sales last month were 2,981 units.c. Make a sales forecast for the following month if there is no change in price or income.d. If price is increased by 5 per cent in general terms, estimate the effect on sales, stating any assumptions.


