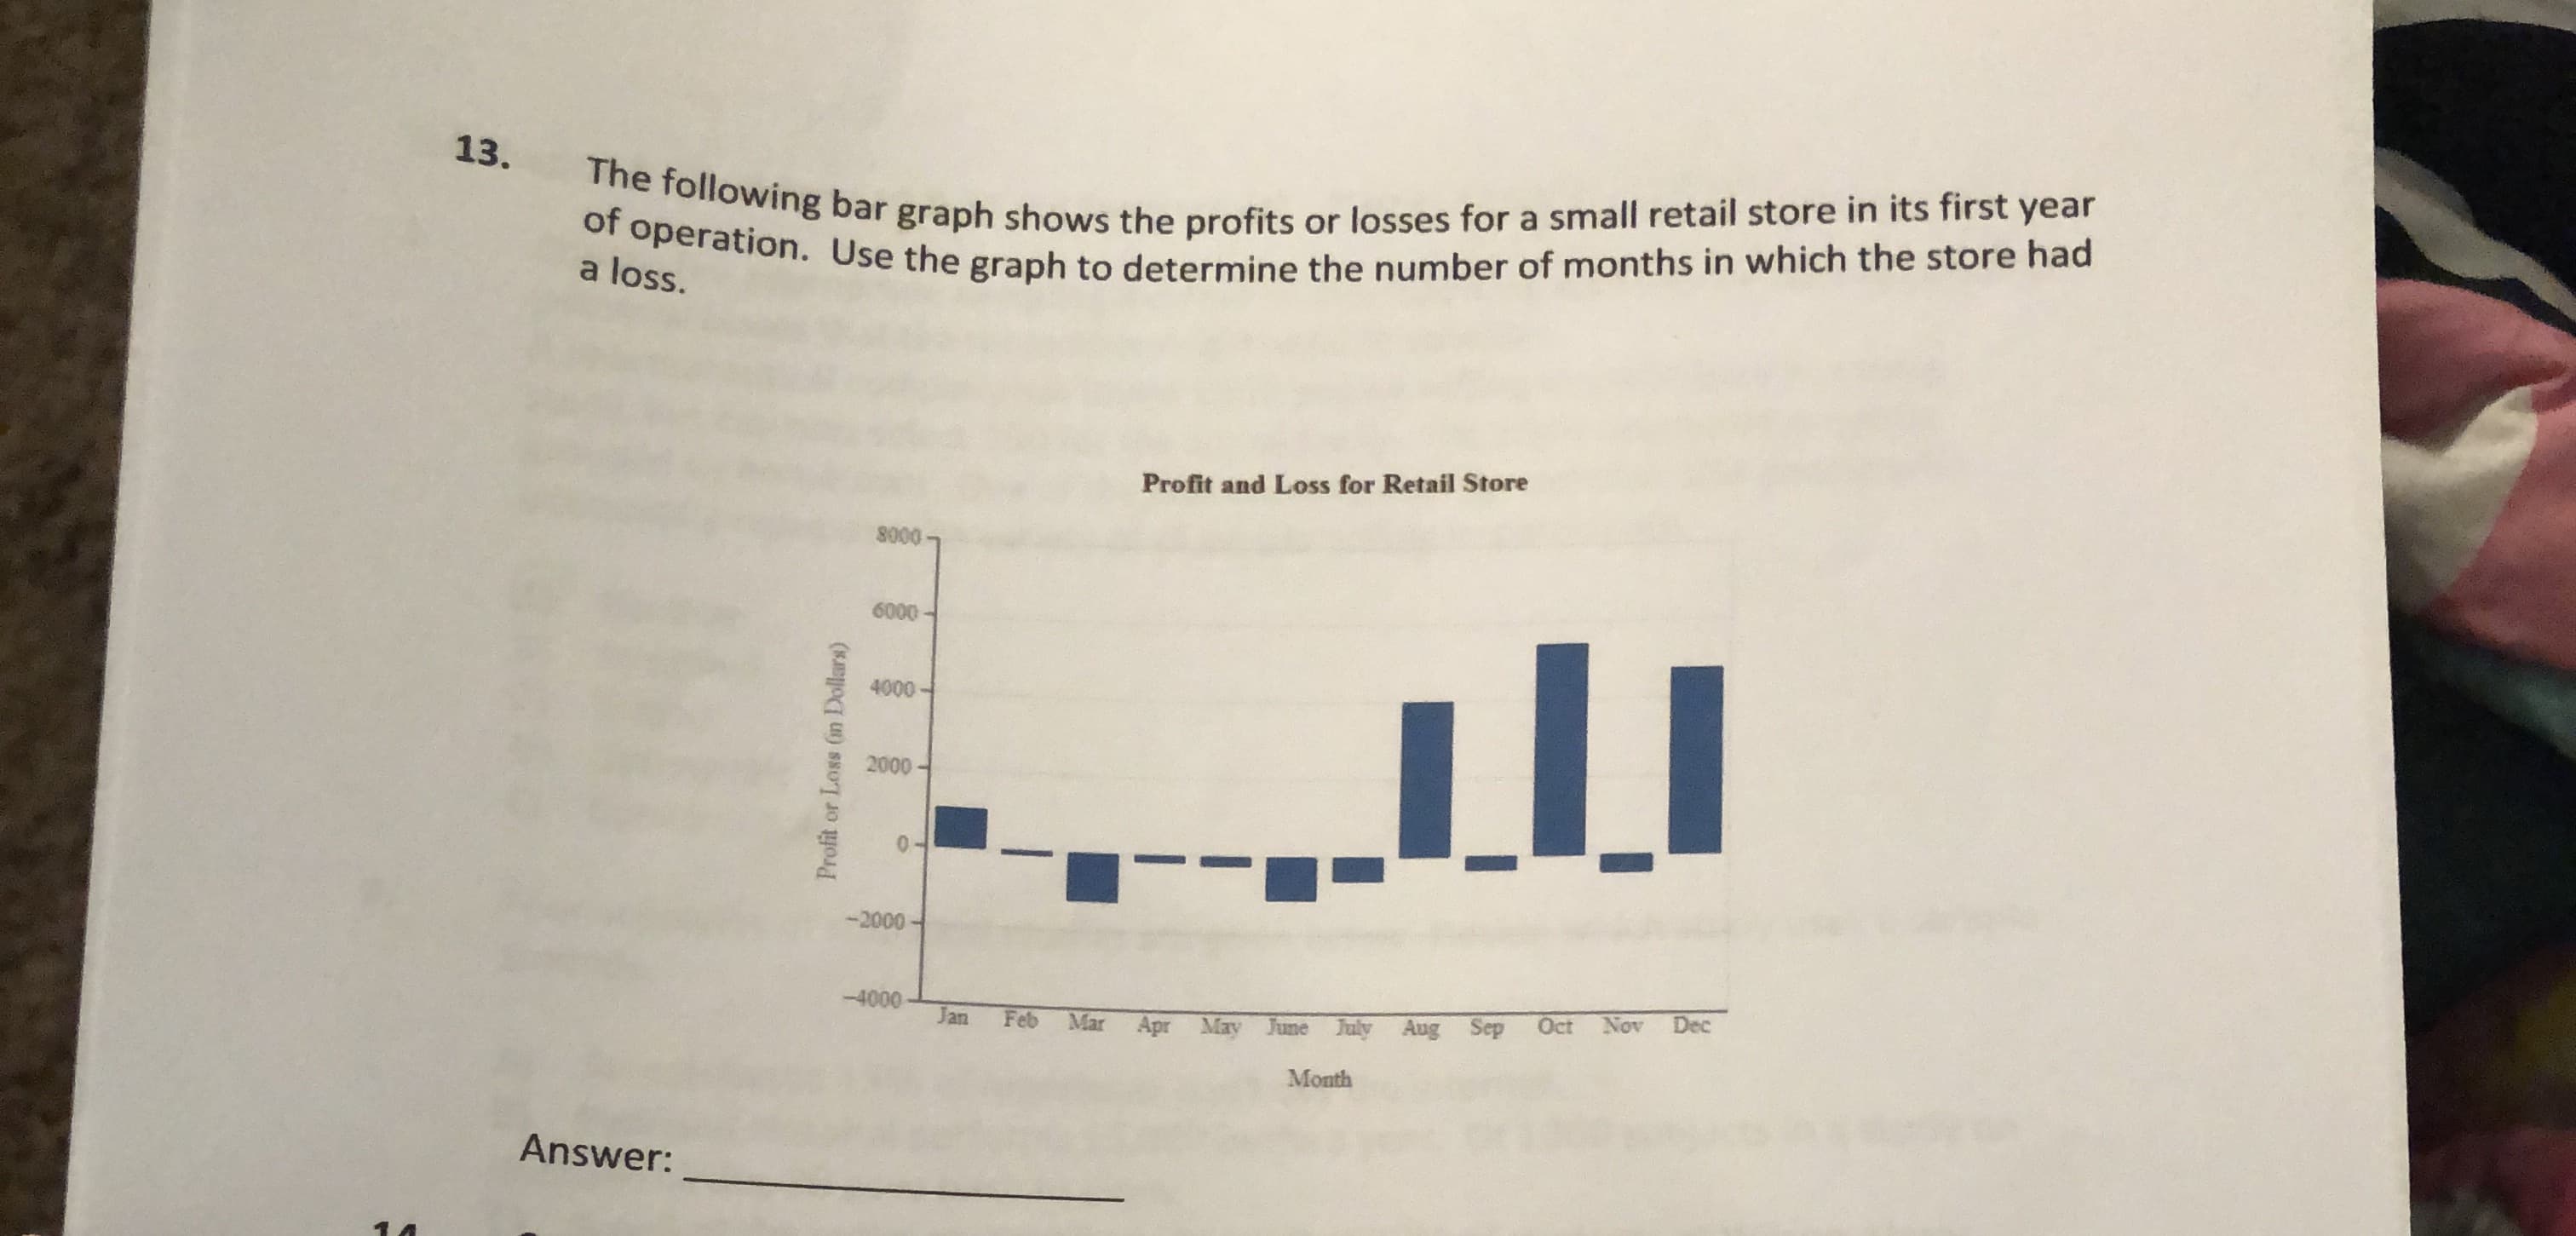
The following bar graph shows the profits or losses for a small retail store in its first year of operation. Use the graph to determine the number of months in which the store had 13. a loss. Profit and Loss for Retail Store 8000- 6000 4000 2000 -2000 -4000 Oct Nov Dec Jan Feb Mar Apr May June July Aug Sep Month Answer:
The following bar graph shows the profits or losses for a small retail store in its first year of operation. Use the graph to determine the number of months in which the store had 13. a loss. Profit and Loss for Retail Store 8000- 6000 4000 2000 -2000 -4000 Oct Nov Dec Jan Feb Mar Apr May June July Aug Sep Month Answer:

Glencoe Algebra 1, Student Edition, 9780079039897, 0079039898, 2018
18th Edition
ISBN:9780079039897
Author:Carter
Publisher:Carter
Chapter10: Statistics
Section10.5: Comparing Sets Of Data
Problem 26PFA

Related questions
Question
Transcribed Image Text:The following bar graph shows the profits or losses for a small retail store in its first year
of operation. Use the graph to determine the number of months in which the store had
13.
a loss.
Profit and Loss for Retail Store
8000-
6000
4000
2000
-2000
-4000
Oct
Nov
Dec
Jan
Feb Mar Apr May June July Aug Sep
Month
Answer:
Expert Solution
This question has been solved!
Explore an expertly crafted, step-by-step solution for a thorough understanding of key concepts.

This is a popular solution!

Trending now
This is a popular solution!

Step by step
Solved in 2 steps with 2 images

Recommended textbooks for you
Glencoe Algebra 1, Student Edition, 9780079039897…
Algebra
ISBN:
9780079039897
Author:
Carter
Publisher:
McGraw Hill

Holt Mcdougal Larson Pre-algebra: Student Edition…
Algebra
ISBN:
9780547587776
Author:
HOLT MCDOUGAL
Publisher:
HOLT MCDOUGAL

Algebra: Structure And Method, Book 1
Algebra
ISBN:
9780395977224
Author:
Richard G. Brown, Mary P. Dolciani, Robert H. Sorgenfrey, William L. Cole
Publisher:
McDougal Littell
Glencoe Algebra 1, Student Edition, 9780079039897…
Algebra
ISBN:
9780079039897
Author:
Carter
Publisher:
McGraw Hill
Holt Mcdougal Larson Pre-algebra: Student Edition…
Algebra
ISBN:
9780547587776
Author:
HOLT MCDOUGAL
Publisher:
HOLT MCDOUGAL
Algebra: Structure And Method, Book 1
Algebra
ISBN:
9780395977224
Author:
Richard G. Brown, Mary P. Dolciani, Robert H. Sorgenfrey, William L. Cole
Publisher:
McDougal Littell