The following calculator shows the demand curve for sedans (for example, Toyota Camrys or Honda Accords) in New York City. For simplicity, assume that all sedans are identical and sell for the same price. Initially, the calculator shows market demand under the following circumstances: Average household income is $50,000 per year, the price of a gallon of regular unleaded gas is $4 per gallon, and the price of a subway ride is $2.00. Use the graph input tool to help you answer the following questions. You will not be graded on any changes you make to this graph. Note: Once you enter a value in a white field, the graph and any corresponding amounts in each grey field will change accordingly. Please consider changing the numerical values for each shifter by 1-2 units for the graph functionality to work properly. 30 8 PRICE (Thousands of dollars per sedan) o e Demand for Sedans Demand 0 100 200 300 400 500 600 700 800 900 QUANTITY (Sedans per month) Graph Input Tool Demand for Sedans Price of a sedan (Thousands of dollars) Quantity Demanded (Sedans per month) Demand Shifters Average Income (Thousands of dollars) Price of Gas (Dollars per gallon) Price of a Subway Ride (Dollars) 20 450 50 4 2 Consider the graph. Suppose that the price of a sedan decreased from $25,000 to $20,000. This would cause a the demand curve. An increase in average income causes a rightward the demand curve; therefore, you may conclude that sedans are good. (Hint: Try substituting different values for Average Income in the calculator and observing what happens.) Suppose that, due to a decrease in the supply of gasoline, the price of a gallon of gas rises from $4 to $5. Because sedans and gasoline are an increase in the price of a gallon of gas shifts the demand curve for sedans to the
The following calculator shows the demand curve for sedans (for example, Toyota Camrys or Honda Accords) in New York City. For simplicity, assume that all sedans are identical and sell for the same price. Initially, the calculator shows market demand under the following circumstances: Average household income is $50,000 per year, the price of a gallon of regular unleaded gas is $4 per gallon, and the price of a subway ride is $2.00. Use the graph input tool to help you answer the following questions. You will not be graded on any changes you make to this graph. Note: Once you enter a value in a white field, the graph and any corresponding amounts in each grey field will change accordingly. Please consider changing the numerical values for each shifter by 1-2 units for the graph functionality to work properly. 30 8 PRICE (Thousands of dollars per sedan) o e Demand for Sedans Demand 0 100 200 300 400 500 600 700 800 900 QUANTITY (Sedans per month) Graph Input Tool Demand for Sedans Price of a sedan (Thousands of dollars) Quantity Demanded (Sedans per month) Demand Shifters Average Income (Thousands of dollars) Price of Gas (Dollars per gallon) Price of a Subway Ride (Dollars) 20 450 50 4 2 Consider the graph. Suppose that the price of a sedan decreased from $25,000 to $20,000. This would cause a the demand curve. An increase in average income causes a rightward the demand curve; therefore, you may conclude that sedans are good. (Hint: Try substituting different values for Average Income in the calculator and observing what happens.) Suppose that, due to a decrease in the supply of gasoline, the price of a gallon of gas rises from $4 to $5. Because sedans and gasoline are an increase in the price of a gallon of gas shifts the demand curve for sedans to the

Microeconomics: Principles & Policy
14th Edition
ISBN:9781337794992
Author:William J. Baumol, Alan S. Blinder, John L. Solow
Publisher:William J. Baumol, Alan S. Blinder, John L. Solow
Chapter4: Supply And Demand: An Initial Look
Section: Chapter Questions
Problem 4TY: The following table summarizes information about the market for principles of economics textbooks:...

Related questions
Question
Uncertain on what to do to solve the problems
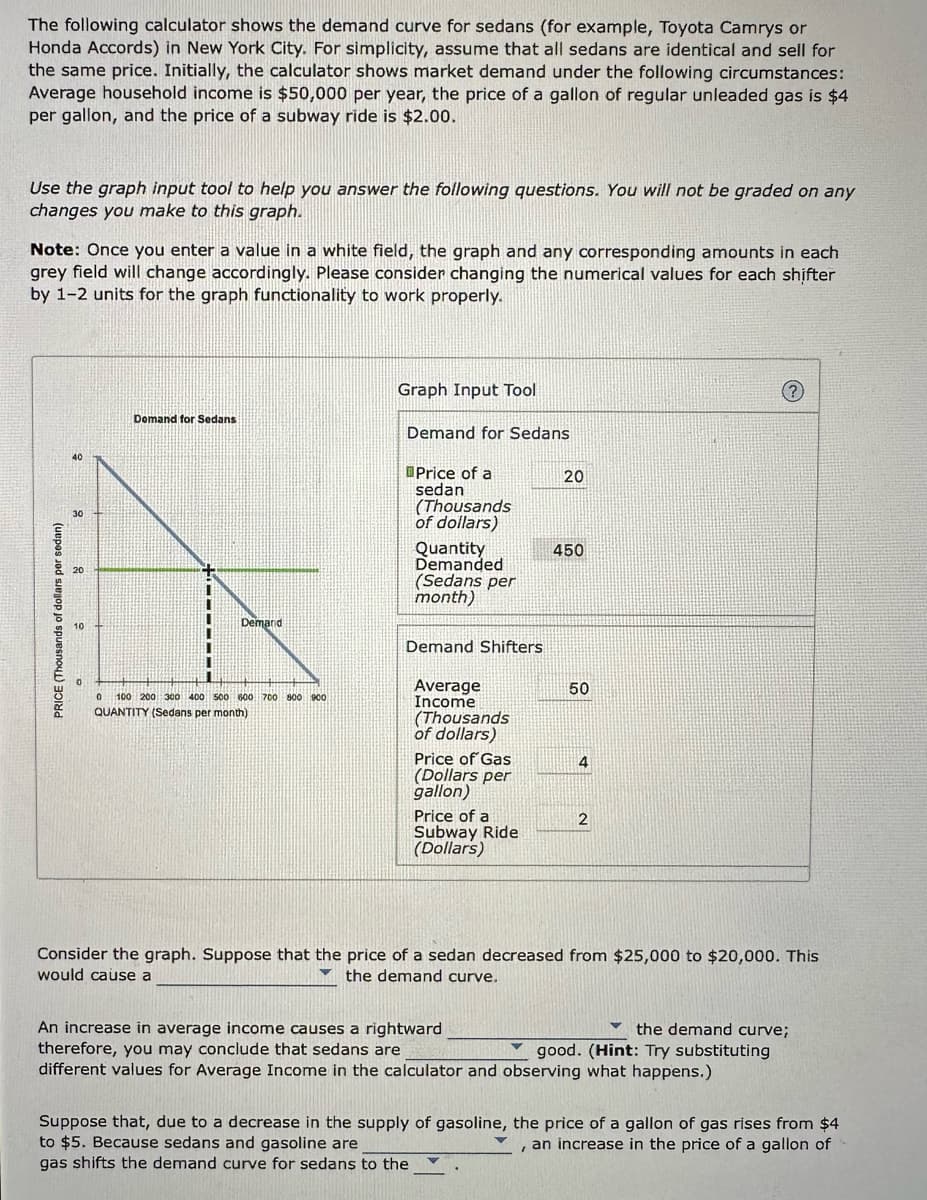
Transcribed Image Text:The following calculator shows the demand curve for sedans (for example, Toyota Camrys or
Honda Accords) in New York City. For simplicity, assume that all sedans are identical and sell for
the same price. Initially, the calculator shows market demand under the following circumstances:
Average household income is $50,000 per year, the price of a gallon of regular unleaded gas is $4
per gallon, and the price of a subway ride is $2.00.
Use the graph input tool to help you answer the following questions. You will not be graded on any
changes you make to this graph.
Note: Once you enter a value in a white field, the graph and any corresponding amounts in each
grey field will change accordingly. Please consider changing the numerical values for each shifter
by 1-2 units for the graph functionality to work properly.
PRICE (Thousands of dollars per sedan)
30
20
Demand for Sedans
Demand
0 100 200 300 400 500 600 700 800 900
QUANTITY (Sedans per month)
Graph Input Tool
Demand for Sedans
Price of a
sedan
(Thousands
of dollars)
Quantity
Demanded
(Sedans per
month)
Demand Shifters
Average
Income
(Thousands
of dollars)
Price of Gas
(Dollars per
gallon)
Price of a
Subway Ride
(Dollars)
20
450
50
4
2
Consider the graph. Suppose that the price of a sedan decreased from $25,000 to $20,000. This
would cause a
V the demand curve.
An increase in average income causes a rightward
the demand curve;
therefore, you may conclude that sedans are
good. (Hint: Try substituting
different values for Average Income in the calculator and observing what happens.)
Suppose that, due to a decrease in the supply of gasoline, the price of a gallon of gas rises from $4
to $5. Because sedans and gasoline are
an increase in the price of a gallon of
gas shifts the demand curve for sedans to the
Expert Solution
This question has been solved!
Explore an expertly crafted, step-by-step solution for a thorough understanding of key concepts.

This is a popular solution!

Trending now
This is a popular solution!

Step by step
Solved in 5 steps with 1 images

Knowledge Booster


Learn more about
Need a deep-dive on the concept behind this application? Look no further. Learn more about this topic, economics and related others by exploring similar questions and additional content below.Recommended textbooks for you
Microeconomics: Principles & Policy
Economics
ISBN:
9781337794992
Author:
William J. Baumol, Alan S. Blinder, John L. Solow
Publisher:
Cengage Learning


Economics Today and Tomorrow, Student Edition
Economics
ISBN:
9780078747663
Author:
McGraw-Hill
Publisher:
Glencoe/McGraw-Hill School Pub Co
Microeconomics: Principles & Policy
Economics
ISBN:
9781337794992
Author:
William J. Baumol, Alan S. Blinder, John L. Solow
Publisher:
Cengage Learning
Economics Today and Tomorrow, Student Edition
Economics
ISBN:
9780078747663
Author:
McGraw-Hill
Publisher:
Glencoe/McGraw-Hill School Pub Co

Principles of Economics 2e
Economics
ISBN:
9781947172364
Author:
Steven A. Greenlaw; David Shapiro
Publisher:
OpenStax


Economics (MindTap Course List)
Economics
ISBN:
9781337617383
Author:
Roger A. Arnold
Publisher:
Cengage Learning