The following data are the numbers of cycles to failure of aluminum test coupons subjected to repeated alternating stress at 21,000 psi, 18 cycles per second. 1115 865 1015 885 1594 1000 1416 1501 1310 2130 845 1223 2023 1820 1560 1238 1540 1421 1674 375 1315 1940 1055 990 1502 1109 1016 2265 1269 1120 1764 1468 1258 1481 1102 1910 1260 910 1330 1512 1315 1567 1605 1018 1888 1730 1608 1750 1085 1883 706 1452 1782 1102 1535 1642 798 1203 2215 1890 1522 1578 1781 1020 1270 785 2100 1792 758 1750 a) Construct a frequency histogram. b) Construct an ogive.
The following data are the numbers of cycles to failure of aluminum test coupons subjected to repeated alternating stress at 21,000 psi, 18 cycles per second. 1115 865 1015 885 1594 1000 1416 1501 1310 2130 845 1223 2023 1820 1560 1238 1540 1421 1674 375 1315 1940 1055 990 1502 1109 1016 2265 1269 1120 1764 1468 1258 1481 1102 1910 1260 910 1330 1512 1315 1567 1605 1018 1888 1730 1608 1750 1085 1883 706 1452 1782 1102 1535 1642 798 1203 2215 1890 1522 1578 1781 1020 1270 785 2100 1792 758 1750 a) Construct a frequency histogram. b) Construct an ogive.

Glencoe Algebra 1, Student Edition, 9780079039897, 0079039898, 2018
18th Edition
ISBN:9780079039897
Author:Carter
Publisher:Carter
Chapter10: Statistics
Section10.1: Measures Of Center
Problem 9PPS

Related questions
Topic Video
Question
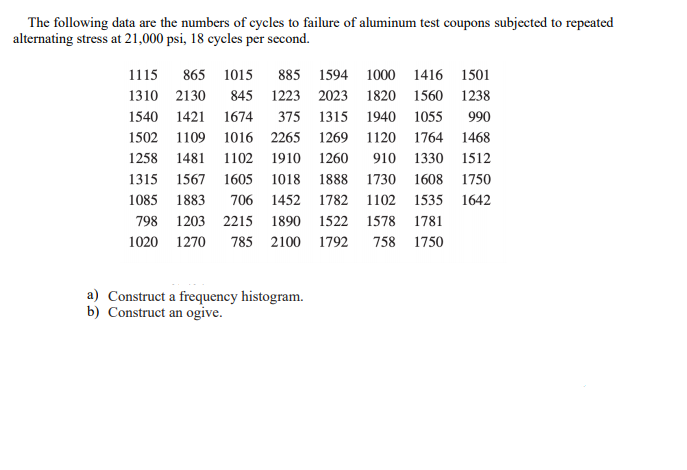
Transcribed Image Text:The following data are the numbers of cycles to failure of aluminum test coupons subjected to repeated
alternating stress at 21,000 psi, 18 cycles per second.
1115
865 1015
885 1594 1000 1416 1501
1310 2130
845 1223 2023 1820 1560 1238
1540 1421 1674
375 1315 1940 1055
990
1502 1109 1016 2265 1269 1120 1764 1468
1258 1481 1102 1910 1260
910 1330 1512
1315 1567 1605 1018 1888 1730 1608 1750
1085 1883
706 1452 1782 1102 1535 1642
798 1203 2215 1890 1522 1578 1781
1020 1270
785 2100 1792
758 1750
a) Construct a frequency histogram.
b) Construct an ogive.
Expert Solution
This question has been solved!
Explore an expertly crafted, step-by-step solution for a thorough understanding of key concepts.

This is a popular solution!

Trending now
This is a popular solution!

Step by step
Solved in 4 steps with 2 images

Knowledge Booster


Learn more about
Need a deep-dive on the concept behind this application? Look no further. Learn more about this topic, statistics and related others by exploring similar questions and additional content below.Recommended textbooks for you
Glencoe Algebra 1, Student Edition, 9780079039897…
Algebra
ISBN:
9780079039897
Author:
Carter
Publisher:
McGraw Hill
Glencoe Algebra 1, Student Edition, 9780079039897…
Algebra
ISBN:
9780079039897
Author:
Carter
Publisher:
McGraw Hill