The following data provides the values of sample mean X and the range R for the samples of size 5 each. Calculate the values for central line and control limits for mean-chart and range chart and determine whether the process is in control. Sample No. : 1 4 7 8 9. 10 Mean (X) 11.2 11.8 10.8 11.6 11.0 9.6 10.4 9.6 10.6 : 10.0 Range (R) 7 4 8. 7 4 8 4 7 : 9 (Conversion factors for m = 5 are A2 = 0.577, D3 = 0 and D4 = 2.115).
The following data provides the values of sample mean X and the range R for the samples of size 5 each. Calculate the values for central line and control limits for mean-chart and range chart and determine whether the process is in control. Sample No. : 1 4 7 8 9. 10 Mean (X) 11.2 11.8 10.8 11.6 11.0 9.6 10.4 9.6 10.6 : 10.0 Range (R) 7 4 8. 7 4 8 4 7 : 9 (Conversion factors for m = 5 are A2 = 0.577, D3 = 0 and D4 = 2.115).

Glencoe Algebra 1, Student Edition, 9780079039897, 0079039898, 2018
18th Edition
ISBN:9780079039897
Author:Carter
Publisher:Carter
Chapter10: Statistics
Section10.4: Distributions Of Data
Problem 19PFA

Related questions
Question
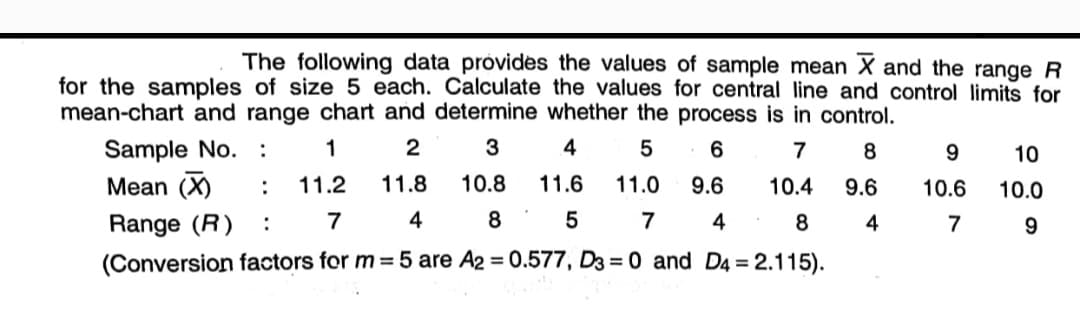
Transcribed Image Text:The following data provides the values of sample mean X and the range R
for the samples of size 5 each. Calculate the values for central line and control limits for
mean-chart and range chart and determine whether the process is in control.
Sample No. :
3
4
7
8
9
10
Mean (X)
11.2
11.8
10.8
11.6
11.0
9.6
10.4
9.6
10.6
:
10.0
Range (R)
7
4
8
5
7
4
8
4
7
:
(Conversion factors for m =5 are A2 = 0.577, D3 = 0 and D4 = 2.115).
Expert Solution
This question has been solved!
Explore an expertly crafted, step-by-step solution for a thorough understanding of key concepts.

Step by step
Solved in 2 steps with 2 images

Recommended textbooks for you
Glencoe Algebra 1, Student Edition, 9780079039897…
Algebra
ISBN:
9780079039897
Author:
Carter
Publisher:
McGraw Hill
Glencoe Algebra 1, Student Edition, 9780079039897…
Algebra
ISBN:
9780079039897
Author:
Carter
Publisher:
McGraw Hill