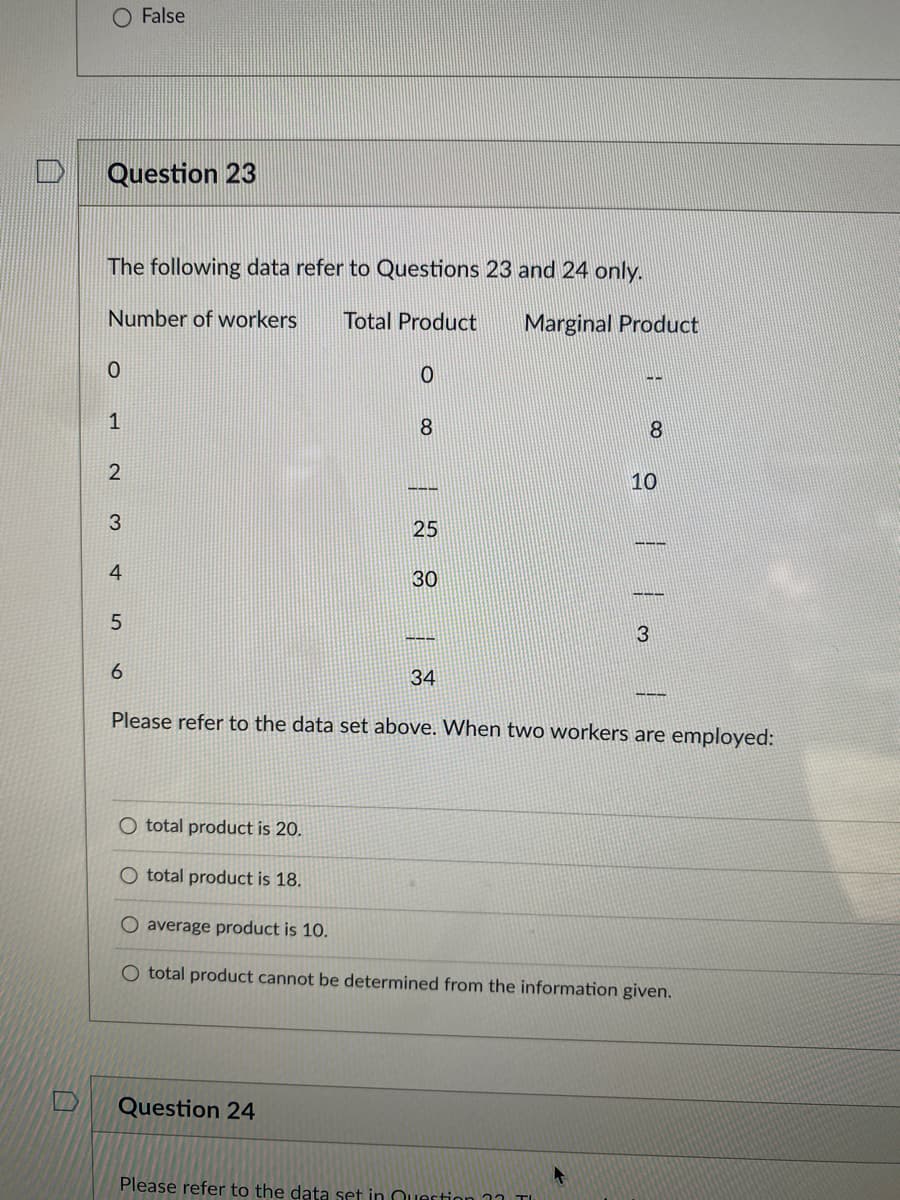
The following data refer to Questions 23 and 24 only. Number of workers Total Product Marginal Product 1 8 2 10 3 25 समाण पेमामा स 4 30 --- 3 6. 34 Please refer to the data set above. When two workers are employed:


Q: Do you want to see if the number of siblings and individual has affects one's social skills. Propose…
A: Economics is a branch of social science that describes and analyzes the behaviors and decisions…
Q: If labor productivity for the first quarter was 575.4 and then when we calculate it for the next…
A: Productivity= Output/Input Productivity means output per input.
Q: If both variables being analyzed are nominal data, the best method to reveal any potential…
A: There are different methods that are used by the researchers and economists to analyze the…
Q: Using the following data calculate: 987,156 Currently Working 23,000 volunteer workers 9845 (ages…
A: Given: 987,156 Currently Working 23,000 volunteer workers 9845 (ages 13-14) looking for work…
Q: The table below is extracted from Goodland Republic Bureau of Statistics records for 2016 -2017. Use…
A: Nominal GDP can be calculated as follows:
Q: 3.Analyze the different indicators we have. You do not need to talk about all the indicators.…
A: An indicator is those which indicate the ongoing patterns and future events. They merely are the…
Q: Mika eams $340 per week which she spends entirely at the grocery store. purchasing either food or…
A: Given: Income=$340 Price of food = $1 Price of alcohol =$4Food Stamps =$65
Q: 45 people were surveyed at the Sunway Pyramid Mall to investigate coffee preferences. The results of…
A: Introduction Here total 45 peoples were given. Children Adult Senior Latte 3 9…
Q: Using the following data calculate: 987,156 Currently Working 23,000 volunteer workers 9845 (ages…
A: Employee participation rate reflects the percentage of all working-age employees employed or job…
Q: What type of data is this, is it (nominal, ordinal, interval or ratio) and summarize it in ways…
A: It is ratioo data.
Q: Read the executive summary thoroughly and attempt the questions given below: The prevailing of fast…
A:
Q: farmer grows strawberries, and sells the strawberries to local farm-to-table restaurants and…
A: Since you have posted a question with multiple sub-parts, we will solve the first three sub-parts…
Q: Key Social and Economic Data Unemployment (% in 2014) Life Expectancy Annual Growth Country (%…
A: In the 1980s the Eastern European countries have adopted economic reforms that changed the economic…
Q: Asaad has a project to sell children's toys, and it achieved a total revenue for this month…
A: Given Total revenue in a month TR=580,000 Number of unit sold in a month =50 Average monthly cost…
Q: makes pots and then sells them door-to-door. Here is the relationship between the number of workers…
A: Making pots and selling them door-to-door is a business that largely depends on the availability of…
Q: In 2000, a law was passed against the use of cell phones while driving in Anytown, N.Y. The number…
A: A line graph is a simple line on the graph paper which explains the relationship between two…
Q: 12. The number of repairs produced by a computer repair shop depends on the number of workers as…
A: Since you have posted a question with multiple sub-parts, we will solve the first three sub-parts…
Q: Prepare a composite (weighted) index for housing construction costs in 2008, using the following…
A: Weighted index is fraction of that years cost compare to total cost of all the year. In this table…
Q: Results of Regressions of Average Hourly Earnings on Gender and Education Binary Variables and Other…
A: (a) Using the regression results in column (1), is the college-high school earnings difference…
Q: Suppose the index of prices received by date farmers in Oman for 2008 was 1.04 and the base year of…
A: The price index measures the changes in the price level of a fixed market basket of goods and…
Q: Candy is a Year 4 full-time undergraduate student majoring in marketing at a private university in…
A: Answers - 1 Opportunity Cost : The benefits that a person, an investor, or a corporation may miss…
Q: Betsy's Bangles produces and sells woven bracelets. The table shows information about the number of…
A: We know marginal product of labour (MPL) = ∆Y/∆L From the table we can observe that for 2 workers,…
Q: If the consumer price index was 96 in 2012, 100 in 2013, and 102 in 2014, then the base year must be…
A: The answer is option B – 2013
Q: The following is a report from a BLS survey taker: “There were 70 people in the houses I visited.…
A: Labor force: It includes all those individuals who are willing and able to work. It includes both…
Q: Construct the consumer price index number for 2017 on the basis of 2016 from the following data…
A: Consumer price Index = ∑RW∑Wwhere R is relative price and W is weightR= P1P0×100
Q: ager and found that a worker produced 225 units while working 50 hours. In the previous week, the…
A: Given information; In the current period, the worker produces 225 units while working 50 hours. In…
Q: The following are the prices of commodities in 2016 and 2017. Calculate price index based on price…
A: Use the below formula to find the relative price: Price relative = P1P0×100
Q: What is the statistical technique for finding the best relationship between dependent variable and…
A: “Since you have asked multiple questions, we will solve the first question for you. If you want any…
Q: This regression is based on cross-section data of 1744 individuals and the relationship between…
A: (a) The slope coefficient of 5.20 indicates that if the age of a specific individual increases by 1…
Q: According to data given in the table, to use index system to analyze the effect price and sales…
A: We are going to analyse the effect of various types of indexes on sales value.
Q: Suppose that New Zombie has adopted the framework used by the US Bureau of Labor Statistics to…
A: Labour force is that part of the population which is actively searching for work. It is the…
Q: In 2017-18, the Pakistan Bureau of Statistics announced that of all adult Pakistanis, 59,786,200…
A: Natural unemployment signifies the average rate of unemployment to which a nation approaches in the…
Q: . Graphing: Infant Mortality in 2005 showed the following leading causes. Present the data in an…
A: Since you have asked multiple questions, we will solve first question for you. If you want any…
Q: 40. The following are the prices of commodities in 2016 and 2017. Calculate a price index based on…
A: In the question above, it is given the prices of commodities in year 2016 and 2017. We have…
Q: a) What is a Z score? Explain. b) A data value of Z score -1. What is the relative position of the…
A: z-score: The z-score is defined as a measure that gives an insight as to how far a particular data…
Q: suppose that 20,000of tghe employed switches to jobs in the underground economy. When interviewed by…
A: c) If 20,000 workers shift to the underground economy and report themselves to be unemployed, then…
Q: Suppose the index of prices received by date farmers in Oman for 2008was 1.04 and the base year of…
A: The price index of the country shows the average price level in the economy. The value of price…
Q: This graph shows the seasonal factor taken out of the series after performing the decomposition.…
A: In the given graph, the data is centered at 0 to make it consistent. This is because of the reason…
Q: Which of the following diagrams shows fixed proportion isoquants? A X2 X1 X2 X1 D X2 X1 O A OB OD
A: Basics:- Isoquant:- It shows the same level of production (quantity) while different combination of…
Q: Read the case study given below and answer ALL the questions given at the end of the case. Workers…
A: Introduction Unemployment has cultural implications that extend beyond monetary value. Jobless…
Q: Using data from 50 workers, a researcher estimates Wage e Education + Experience + AAge + e, where…
A: Multiple regression can be defined as a study of the relationship between one variable called the…
Q: The following relationships between wage (W) and education (EDU) are estimated using a sample of 100…
A: 1) The estimated (fitted) model is given as, where , , Null Hypothesis , H0 : Alternate…
Q: Results of Regressions of Average Houry Earning Education Binary Variables and Other Characteristics…
A: The regression equation for the second column is Y = 4.49 + 5.59(X1) - 2.67(X2) + 0.30 (X3) taking…
Q: The following graph shows the labor market for research assistants in the fictional country of…
A: Labour economics seeks to comprehend the operation and dynamics of wage labour markets. Labor is a…
Q: A company sells three types of products for $20, $15, and $10 per unit. In 1 year, the total revenue…
A: Total revenue is the total receipts collected from the sale of the goods and services in the market.…
Q: Differentiate and explain the following terms: iii. Nominal Scale and Ordinal Scale
A: Scale is used to measure or quantify any event or object. There is four data measurement scale which…


Trending now
This is a popular solution!

Step by step
Solved in 2 steps with 1 images


- MP believe that there is a causal relationship between earnings and years of schooling. They show you an estimate of the impact of years of schooling on annual earnings: There are two groups of individuals – group 1 and group 2. Group 1 on average earns £60,000 per year with the average level of post-compulsory education of 6 years, while group 2 earns on average £40,000 with the average post-compulsory education of 4 years. The MPs conclude that the annual return to an additional year of education is 25% using the following equation [(£60,000-£40,000)/40,000]/(6-4)=25%. Ignoring time preferences and discounting, and if both groups face the same cost of schooling, you need to explain to the MPs why this is not a good estimate of the annual return to an additional year of education. Propose methods to the MPs to deal with the problemEducation: Does College Pay Off? It is costly in both time and money to go to college.Does it pay off? According to the Bureau of the Census, the answer is yes. The averageannual income (in thousands of dollars) of a household headed by a person with thestated education level is as follows: 24.3 if ninth grade is the highest level achieved.41.4 forhigh school graduates. 59.7 for those holding associate degrees, 82.7 for thosewith bachelor's degrees, 100.8 for those with master’s degrees, and 121.6 for thosewith doctoral degrees. Make a bar graph showing household income for eacheducation levelLabor economists studying the determinants of women’s earnings discovereda puzzling empirical result. Using randomly selected employedwomen, they regressed earnings on the women’s number of children anda set of control variables (age, education, occupation, and so forth). Theyfound that women with more children had higher wages, controlling forthese other factors. Explain how sample selection might be the cause ofthis result. (Hint: Notice that women who do not work outside the homeare missing from the sample.) [This empirical puzzle motivated JamesHeckman’s research on sample selection that led to his 2000 Nobel Prizein Economics. See Heckman (1974).]
- Labour or work relationships have existed since the first individual approached another to perform a task against the promise of payment. Therefore, the employment relationship should be placed in the context of one of the mosty important occurences in economic history, the industrial revolution. In the view of the statement, citically assess the convulsion of the industrial revolution which commenced in the fourteenth century ans resulted in the emergence of the working class. Provide a detailed analysis of the employment relationship between the parties involved in the early years of the industrial revolutionWorkers are compensated by firms with benefits in addition to wages and salaries. The most prominent offered by many firms is health insurance. Suppose that in 2000, workers at one steel plant were paid $30 per hour and in addition received health benefits at the rate of $6 per hour. Also suppose that by 2010 workers at that plant were paid $31.50 per hour but received $13.5 in heakth insurance benefits. a. By what precentage did total compensation (wages plus benefits ) change at this plant from 2000 to 2010? Total compensation increased or decreased by________ percent? What was the approximate average annual percentage change in total compensation? b. By what percetage did wages change at this plant from 2000 to 2010? Wages increased or decreased by ______percent? What was the approximate average annual percentage in wages? c. If workers value a dollar of heath benefits as much as they value a dollar of wages, by what total percentage will they feel their incomes have risen over…Q. 1 You are the mayor of a small town with 2000 residents. The head of your economic development agency recently conducted a survey in which the 2000 residents said that a public concert in the centre of town would be worth $20 to cach of them. Since it costs only $5000 to hold the concert, you organized and held the concert, which everyone in town enjoyed. But when you asked for donations to pay for the concert, you only collected $30 in total. What do you know? a. The survey certainly overstated how much the concert was worth to each resident. b. From the standpoint of total costs and benefits, the cost of the concert certainly exceceded the benefit. c. The concert was an example of the Tragedy of the Commons. d. Residents of the town were probably free riders.
- Average Earnings by Innnigrant Cohort 2010 2010 2015 2015 Cohort Label YSM Earnings (S) YSM Earnings ($) Native-born Native N/A 73,915 N/A 80,245 1955-1959 1M5559 52.5 97,361 57.5 97,212 1960-1964 1M6064 47.5 91,822 52.5 93,156 1965-1969 1M6569 42.5 88,610 47.5 106,552 1970-1974 1M7074 37.5 88,392 42.5 93,163 1975-1979 1M7579 32.5 85,919 37.5 97,756 1980-1984 1M8084 27.5 79,911 32.5 81,500 1985-1989 1M8589 22.5 70,143 27.5 78,100 1990-1994 1M9094 17.5 64,342 22.5 69,033 1995-1999 1M9599 12.5 68,821 17.5 73,976 2000-2004 IM0004 7.5 66,971 12.5 74,907 2005-2009 IM0509 2.5 58,623 7.5 67,780 2010-2014 IM1014 2.5 60,596 NOTE: "YSM" refers to the average years since migration. This is a table of average earnings for various immigration cohorts as well as native-born Canadians for 2010 and 2015. These values are expressed in 2015 real dollars. A) Calculate the cross-sectional entry effect for the IM0509 cohort. Interpret what the number…Q1(a) When a company buys medical insurance for all its workers, the insurance premium per workers is generally much cheaper on the average for comparable coverage, compared to insurance purchased by individuals. The difference in cost may not be just due to differences in the administration costs in handling bulk insurance policies in a company’s transaction. Explain, in the context of information, for this cost differential. (b) It is discovered that children who attended pre-schools are helpful and considerate in the society. However, preschool is optional and very costly. Not all parents send their children to pre-school. (i) Use an appropriate diagram, depict the market for pre- school and explain the type of externality described. Is the market efficient? (ii) From social efficiency point of view, should the government make it compulsory for all parents to send their children to pre-school? Explain.What is Lerner index? How is it calculated? What does it calculated outcome tell us?
- Some MPs believe that there is a causal relationship between earnings and years of schooling. They show you an estimate of the impact of years of schooling on annual earnings: There are two groups of individuals – group 1 and group 2. Group 1 on average earns £60,000 per year with the average level of post-compulsory education of 6 years, while group 2 earns on average £40,000 with the average post-compulsory education of 4 years. The MPs conclude that the annual return to an additional year of education is 25% using the following equation [(£60,000-£40,000)/40,000]/(6-4)=25%. Ignoring time preferences and discounting, and if both groups face the same cost of schooling, you need to explain to the MPs why this is not a good estimate of the annual return to an additional year of education. Propose methods to the MPs to deal with the problem. (300 words)Year Month GOIL December 0.241667 2011 January 0.258333 February 0.258333 March 0.25 April 0.258333 May 0.266667 June 0.258333 July 0.258333 August 0.266667 September 0.266667 October 0.266667 November 0.258333 December 0.266667 2012 January 0.266667 February 0.266667 March 0.283333 April 0.316667 May 0.391667 June 0.408333 July 0.433333 August 0.45 September 0.458333 October 0.5 November 0.516667 December 0.516667 2013 January 0.566667 February 0.741667 March 0.866667 April 1.125 May 1.166667 June 1.041667 July 0.691667 August 0.725 September 0.75 October 0.75 November 0.775 December 0.89 2014 January 0.89 February 0.77 March 0.81 April 0.89 May 0.9…Data 1:*2008 and 2013 National Demographic Health Survey showed that the percentage of womenage 15- 19 who had a live birth or is pregnant with first child had increased from 9.9% - 10.1% inthe country.*In Region 1, the percentage of women age fifteen 15 - 24 who havebegun childbearing also increased from 26% - 29%. This was attributed to the following riskybehaviors identified by the adolescents during the Regional Adolescent Congress: Early sex,Substance abuse, Pornography, VAWC (rape case), Fraternities (bad gangs) & Prostitution. Questions:1. What is the impact of the given data to mortality and morbidity rate of adolescent population? 2. What is the impact of the given data to mortality and morbidity rate of neonatal population? 3. Give at least 3 social determinants of health which are contributory factors leading to the datapresented and justify..


