The following data represent the calories and fat, in grams, of various 16-ounce iced coffee drinks. a. Compute the sample covariance. (Round to three decimal places as needed.) Product Calories Fat 240 9.0 b. Compute the coefficient of correlation. 290 3.9 350 22.0 380 21.7 (Round to three decimal places as needed.) 490 17,7 c. Which do you think is more valuable in expressing the relationship between calories and fat-the covariance or the coefficient of correlation? Explain. F 520 20.4 G 600 19.5 O A. The correlation is more valuable. It can be used to determine the relative strength of a linear relationship. Use the data above to complete parts (a) to (d) O B. The correlation is more valuable. It is the better measure for positive relationships. O C. The covariance is more valuable. It is an exact measure of the strength of a linear relationship.
The following data represent the calories and fat, in grams, of various 16-ounce iced coffee drinks. a. Compute the sample covariance. (Round to three decimal places as needed.) Product Calories Fat 240 9.0 b. Compute the coefficient of correlation. 290 3.9 350 22.0 380 21.7 (Round to three decimal places as needed.) 490 17,7 c. Which do you think is more valuable in expressing the relationship between calories and fat-the covariance or the coefficient of correlation? Explain. F 520 20.4 G 600 19.5 O A. The correlation is more valuable. It can be used to determine the relative strength of a linear relationship. Use the data above to complete parts (a) to (d) O B. The correlation is more valuable. It is the better measure for positive relationships. O C. The covariance is more valuable. It is an exact measure of the strength of a linear relationship.

Glencoe Algebra 1, Student Edition, 9780079039897, 0079039898, 2018
18th Edition
ISBN:9780079039897
Author:Carter
Publisher:Carter
Chapter10: Statistics
Section10.4: Distributions Of Data
Problem 19PFA

Related questions
Question
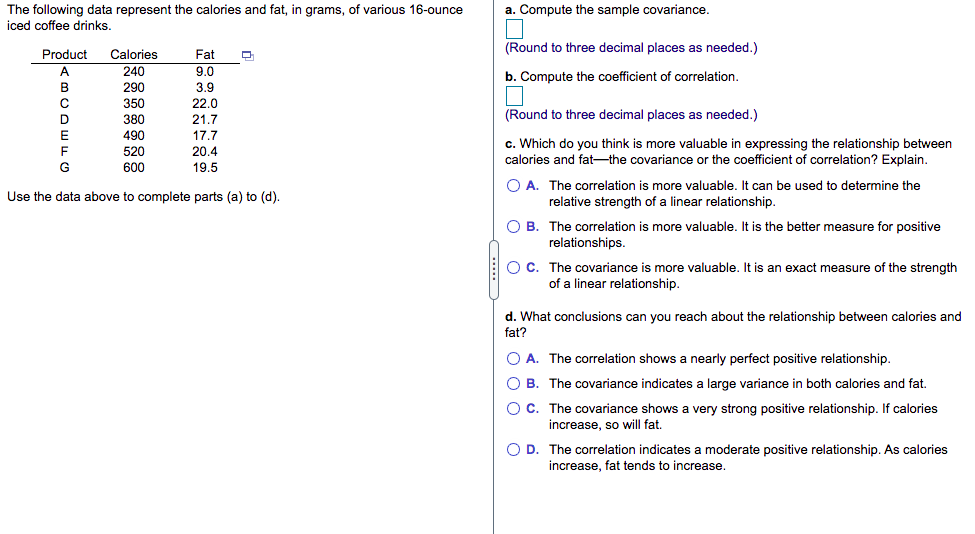
Transcribed Image Text:The following data represent the calories and fat, in grams, of various 16-ounce
a. Compute the sample covariance.
iced coffee drinks.
(Round to three decimal places as needed.)
Product
Calories
Fat
A
240
9.0
b. Compute the coefficient of correlation.
B
290
3.9
350
22.0
(Round to three decimal places as needed.)
21.7
17.7
20.4
D
380
490
520
600
c. Which do you think is more valuable in expressing the relationship between
calories and fat-the covariance or the coefficient of correlation? Explain.
F
G
19.5
O A. The correlation is more valuable. It can be used to determine the
relative strength of a linear relationship.
Use the data above to complete parts (a) to (d).
O B. The correlation is more valuable. It is the better measure for positive
relationships.
OC. The covariance is more valuable. It is an exact measure of the strength
of a linear relationship.
d. What conclusions can you reach about the relationship between calories and
fat?
O A. The correlation shows a nearly perfect positive relationship.
O B. The covariance indicates a large variance in both calories and fat.
O C. The covariance shows a very strong positive relationship. If calories
increase, so will fat.
O D. The correlation indicates a moderate positive relationship. As calories
increase, fat tends to increase.
Expert Solution
This question has been solved!
Explore an expertly crafted, step-by-step solution for a thorough understanding of key concepts.

This is a popular solution!

Trending now
This is a popular solution!

Step by step
Solved in 3 steps with 1 images

Recommended textbooks for you
Glencoe Algebra 1, Student Edition, 9780079039897…
Algebra
ISBN:
9780079039897
Author:
Carter
Publisher:
McGraw Hill
Glencoe Algebra 1, Student Edition, 9780079039897…
Algebra
ISBN:
9780079039897
Author:
Carter
Publisher:
McGraw Hill