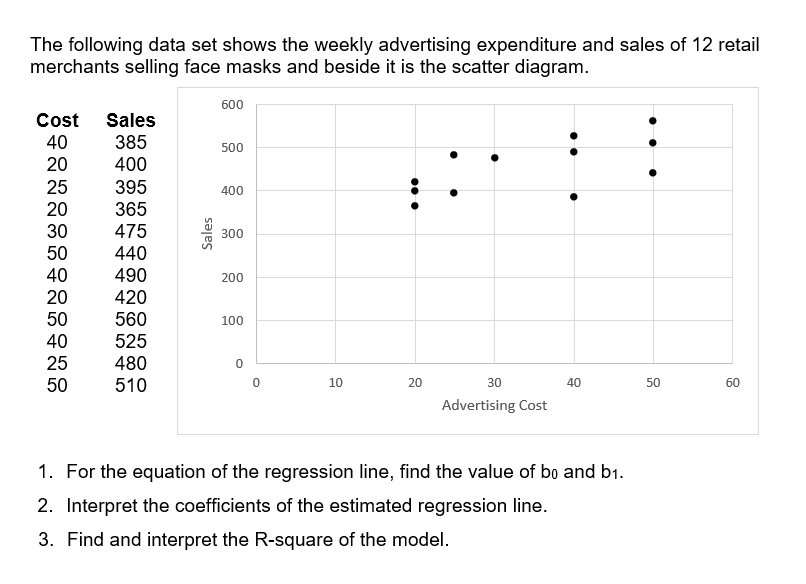
The following data set shows the weekly advertising expenditure and sales of 12 retail merchants selling face masks and beside it is the scatter diagram. 600 Cost Sales 40 385 500 20 400 25 395 400 20 365 30 475 300 50 440 40 490 200 20 420 50 560 100 40 525 25 480 0 50 510 0 10 20 30 40 50 60 Advertising Cost 1. For the equation of the regression line, find the value of bo and b₁. 2. Interpret the coefficients of the estimated regression line. 3. Find and interpret the R-square of the model. Sales
Q: Data on 4500 college graduates show that the mean time required to graduate with a bachelor's degree…
A: Given data: n = 4500 Mean(x-bar) = 6.35 years Standard deviation =1.73 years Confidence level = 95%
Q: 190 150 195 163 210 140 180 156 200 148 143 124 149 125 240 170 158 133 235 165 169 135 192 160 170…
A: *Answer: Step 2 A) The general form of regression line is given as: y=a+bx where a is the…
Q: Find the indicated area under the standard normal curve Between z = - 0.15 and z = 0.15
A:
Q: State the alternative hypothesis. a. Ha : σ^2 > 1.6 b. Ha : σ^2 < 1.6 c. Ha : σ^2 ≠ 1.6 2.…
A: Given that Sample size n =30 Sample variance =2.3 Population variance =1.6 NOTE:- According to…
Q: #3. Choose the letter of the correct answer. An ogive is a graphical representation of a. Cumulative…
A: The objective is to find the correct option from the given choices.
Q: If 3 books are picked at random from a shelf containing 5 novels, 3 books of poems and a dictionary,…
A: There are total 9 books on the shelf. The total ways is C(9,3) =9!(9-3)!*3!=84 ways We pick up 2…
Q: 9.0 18.6 86.5 1.8 5.8 28.6 2.0 9.3 18.8 84.5 2.1 5.2 30.6 21 9.3 20.4 88.8 1.9 5.6 32.4 2.2 9.5 19.0…
A: *Answer: *a The regression model with x1, x2, x5, and x6 regressors y =…
Q: Consider the following sample observations on stabilized viscosity of asphalt specimens. 2,797 2,907…
A: From the provided information, Sample size (n) = 5 Level of significance (α) = 0.05
Q: 16. The data set below shows the cost of a gallon of milk in dollars in 5 different cities. Which of…
A: Given that data 2.57,4.15,3.72,1.99,6.12
Q: 3. Powder milk is packed in 1-kilogram. An inspector from the Department of Trade and Industry (DTI)…
A: It is given that: x¯ sample average weight=0.96n sample size=40s sample SD=0.12μ0 claimed weight at…
Q: A random sample of 1200 apples was taken from a large consignment and found that 10% of them were…
A: Given that: Sample proportion, p^=0.1 Population proportion, p = 0.02 Sample size, n = 1200
Q: Z-TEST FOR A MEAN WHEN IS THE STATISTICAL TEST APPROPRIATE TO USE OR APPLICABLE? Type of Data Is…
A: In testing of hypothesis, numerous statistical tests are performed to make valid results. It helps…
Q: 4. The highest bar in a histogram represents? a. The class with the lowest frequency. b. The class…
A: The highest bar in a histogram represents: d. The class with the highest frequency.
Q: When bonding teeth, orthodontists must maintain a dry field. A new bonding adhesive has been…
A: The following information has been given: The sample size is n=12. The sample mean is X¯=4.56. The…
Q: Statistics Grade IQ Score Student 65 50 55 5 70 65 70 5 70 50 5 75 80 65 70| 1234567890123415
A: Given Information: No. of variables=02Variables=1.IQ score.2.Statistics grade.r=-0.045Pearson r…
Q: X is a random variable with mean and variance Hand o² The x-μ standardized form of X is Z= what are…
A: Given that By design and definition, Z always has a mean of 0 and a standard deviation = 1 since…
Q: A certain statistics instructor participates in triathlons. The accompanying table lists times (in…
A: Since, we answer only up to three sub parts of a problem, we'll be answering the first three sub…
Q: II. Complete the table below. Use z-Critical Value Table or t-Critical Value Table. Type of Test a…
A: Explanation: 1. Type of test: Two tailed. Significance level α = 0.01 Sample size n = 15 Computed…
Q: Test whether there is a significant difference in the average miles per gallon performance (mpg)…
A: Given Information: Consider the given sorted data: MPG-Automatic MPG-Manual 21.4 21 18.7 21…
Q: A single-phase waiting-line system meets the assumptions of constant service time or M/D/1. Units…
A: The arrival rate is λ=6015=4 The service rate is μ=6010=6
Q: A random sample of 400 men from one stage gives the mean pay of Rs. 200 per day with a standard…
A:
Q: Assign Temperature to be factor affecting Proportion of Impurities Temperature (°C) Proportion of…
A: For the given data Select the correct choice
Q: The following table shows the annual family income of the students enrolled in the JRMSU-TC and…
A: Hi! Thank you for the question, As per the honor code, we are allowed to answer three sub-parts at a…
Q: Agan Interior Design provides home and office decorating assistance to its customers. In normal…
A:
Q: The following table shows the annual family income of the students enrolled in the JRMSU-TC and…
A: Excel procedure to plot regression line: Enter the data in an excel sheet. Select the data of two…
Q: A group of automotive engineers decided to conduct a study of its school buses and found that for 32…
A: (a) Obtain the margin of error at the 99% confidence interval for the mean. The margin of error at…
Q: 3. The following data shows the results of 4 students in a 50-item multiple choice exam: 47, 36, 42,…
A: Formula : range=maximum - minimum
Q: If 3 books are picked at random from a shelf containing 5 novels, 3 books of poems and a dictionary,…
A:
Q: 6. The weights (in pounds) of 30 ne 5.5 5.7 5.8 5.9 6 6.7 6.7 6.9 7 7.5 77 7.7 7 6.7 7.4 ] Find the…
A: Quartile is the measure that divide the data set into four equal parts with three points. These…
Q: A researcher conducts a diagnostic examination to 20 students. The following are the interpretation…
A: A researcher conducts a diagnostic examination to 20 students. The following are the interpretation…
Q: Question 3 A sample of 44 commuters in Chicago showed the average of the commuting times was 33.2…
A: "Since you have asked multiple questions, we'll solve the first question for you. If you want any…
Q: Number of Bacteria Minutes of Exposure 1 175 108 2 95 3 82 4 71 5 50 6 49 7 31 8 28 9 17 10 16 11 11…
A: *Answer: *B
Q: Construct a relative frequency distribution. Round the answers to two decimal places. Response…
A:
Q: 10. What kind of graph would you use to represent the annual number of vehicle fatalities in the…
A: 10. The line chart is used to represents the annual number of vehicle fatalities in the city for the…
Q: Target Method: Z-Test for two independent samples A study was conducted to compare the average…
A: The provided information is n1=45 , n2=40x¯1=119 , x¯1=11σ1=11.9 ,…
Q: Suppose you took a test and your score was reported as a z-score instead of a percentage. If your…
A:
Q: Does exposure to classical music (through instrument lessons or concert attendance) improve a…
A: Variables in a research study: Variables may be defined as a characteristic of a population which…
Q: Mr Martin can drive to work along four different routes. The following are the number of minutes the…
A: State the hypotheses: Null hypothesis: H0:µ1 = µ2 = µ3 Alternative hypothesis: H0: Not all the…
Q: A sample of 14 commuters in Cebu showed the average of the commuting times was 33.2 minutes. If the…
A:
Q: 1. A student listed 10 of his classmates' scores: 34, 42, 27, 34, 45, 32, 31, 44, 33, 31 a.…
A: Formula : sample mean : x̄=Σx/n
Q: PROBLEM 5: The hypotheses are Ho: μ = 10 versus H₂ : μµ> 10. The test statistic for a significance…
A: 5. The provided information is Ho:µ=10 Ha:µ>10 The test statistics is z=-2.12 The p-value…
Q: A population has an unknown mean and standard deviation 7. From a random sample, we know: n = 50…
A: For the given data Perform z test for one sample mean
Q: a. Describe the sampling distribution of Choose the correct answer below. OA. The sampling…
A: It is given that The null and alternative hypotheses are: H0: μ = 66 H1: μ > 66 n = 415, σ…
Q: For detyron, calf dehorning has become a routine practice at dairy farms. A report from a particular…
A:
Q: Find the mean, median, and mode of the following data. If necessary, round to one more decimal place…
A: We have to arrange data in ascending order:…
Q: 4.7 Consider the simple linear regression model fit to the weight and blood pressure data in.…
A: Residual explain the error happen in the data set. It is calculated by the difference of actual and…
Q: Evaluate x = μ+zo if μ= 79.9, z=3.91, and o=4.8. XF (Type an integer or decimal. Do not round.)
A: It is given that μ = 79.9 z = 3.91 σ = 4.8
Q: How many outcomes are possible if you toss a coin six times?
A: Given data How many outcomes are possible if you toss a coin six times.
Q: Target Topic: Similarity in terms of the average systolic blood pressure between male and female…
A: The provided information is x¯1=119, x¯2=115σ1=11.9, σ2=10.5n1=45, n2=40α=0.05a.The null and…
Q: What is the probability of this player hiting more than 13 shots (13,14,15,..., or 25)
A:
Answer the following questions about the regression equation.
Step by step
Solved in 4 steps with 4 images
- Consider the following set of ordered pairs. x 4 2 4 2 7 6 y 4 9 7 6 2 5 a) Calculate the slope and the y-intercept for the regression equation. b) Calculate the SST. c) Partition the SST into the SSR and the SSE.Find b0 and b1 and derive the regression line equation for the data below: x y 0 2 1 3 2 5 3 7 4 10 5 9Consider the following data set, where yy is the final grade in a math class and xx is the average number of hours the student spent working on math each week. hours/weekx Gradey 5 58 8 63.2 8 73.2 9 68.6 9 70.6 11 68.4 13 81.2 14 86.6 17 100 20 100 The regression equation is y=3.04⋅x+42.33y=3.04⋅x+42.33.Explain what the value of the slope means in this situation, where yy is the final grade in a math class and xx is the average number of hours the student spent working on math each week.Explain what the value of the y-intercept means in this situation.What is the predicted value for the final grade when a student spends an average of 15 hours each week on math?Grade = Round to 1 decimal place.
- The following data show the brand, price($), and the overall score for 6 stereo headphones that were tested by Consumer Reports. The overall score is based on sound quality and effectiveness of ambient noise reduction. Scores range from 0 (lowest) to 100 (highest). The estimated regression equation for these data is y=23.043+2.7x , where x=price and y=overall score . Brand Price Score Bose 170 75 Scullcandy 160 71 Koss 95 62 Phillips/O'Neill 70 56 Denon 60 40 JVC 45 26 Round your answers to three decimal places. a. Compute SST,SSR , and SSE. SST (to 3 decimals) SSR (to 3 decimals) SSE (to 3 decimals) c. What is the value of the sample correlation coefficient? rxy=The following data show the brand, price ($), and the overall score for six stereo headphones that were tested by a certain magazine. The overall score is based on sound quality and effectiveness of ambient noise reduction. Scores range from 0 (lowest) to 100 (highest). The estimated regression equation for these data is ŷ = 21.592 + 0.324x, where x = price ($) and y = overall score. Brand Price ($) Score A 180 76 B 150 69 C 95 61 D 70 56 E 70 38 F 35 24 (a) Compute SST, SSR, and SSE. (Round your answers to three decimal places.) (b) Compute the coefficient of determination r2. (Round your answer to three decimal places.) (c) What is the value of the sample correlation coefficient? (Round your answer to three decimal places.)The following data show the brand, price ($), and the overall score for six stereo headphones that were tested by a certain magazine. The overall score is based on sound quality and effectiveness of ambient noise reduction. Scores range from 0 (lowest) to 100 (highest). The estimated regression equation for these data is ŷ = 21.258 + 0.327x, where x = price ($) and y = overall score. Brand Price ($) Score A 180 74 B 150 73 C 95 59 D 70 54 E 70 40 F 35 24 (a) Compute SST, SSR, and SSE. (Round your answers to three decimal places.) SST= SSR= SSE= (b) Compute the coefficient of determination r2. (Round your answer to three decimal places.) r2 = Comment on the goodness of fit. (For purposes of this exercise, consider a proportion large if it is at least 0.55.) The least squares line provided a good fit as a large proportion of the variability in y has been explained by the least squares line.The least squares line did not provide a good fit as a large…
- The following data show the brand, price ($), and the overall score for six stereo headphones that were tested by a certain magazine. The overall score is based on sound quality and effectiveness of ambient noise reduction. Scores range from 0 (lowest) to 100 (highest). The estimated regression equation for these data is ŷ = 22.391 + 0.326x, where x = price ($) and y = overall score. Brand Price ($) Score A 180 76 B 150 71 C 95 63 D 70 56 E 70 40 F 35 24 #1) Compute SST, SSR, and SSE. (Round your answers to three decimal places.) SST = SSR = SSE = #2) Compute the coefficient of determination r2.(Round your answer to three decimal places.) r2 = #2a) Comment on the goodness of fit. (For purposes of this exercise, consider a proportion large if it is at least 0.55.) A) The least squares line provided a good fit as a small proportion of the variability in y has been explained by the least squares line. B) The least squares line provided a good fit as a large…The following data show the brand, price ($), and the overall score for six stereo headphones that were tested by a certain magazine. The overall score is based on sound quality and effectiveness of ambient noise reduction. Scores range from 0 (lowest) to 100 (highest). The estimated regression equation for these data is ŷ = 22.726 + 0.323x, where x = price ($) and y = overall score. Brand Price ($) Score A 180 76 B 150 71 C 95 61 D 70 56 E 70 42 F 35 24 (a) Compute SST, SSR, and SSE. (Round your answers to three decimal places.) SST= ? SSR= ? SSE= ? (b) Compute the coefficient of determination r2. (Round your answer to three decimal places.) r2= ? Comment on the goodness of fit. (For purposes of this exercise, consider a proportion large if it is at least 0.55.) The least squares line provided a good fit as a small proportion of the variability in y has been explained by the least squares line. The least squares line provided a good fit as a large proportion…The following data show the brand, price ($), and the overall score for six stereo headphones that were tested by a certain magazine. The overall score is based on sound quality and effectiveness of ambient noise reduction. Scores range from 0 (lowest) to 100 (highest). The estimated regression equation for these data is ŷ = 23.462 + 0.315x, where x = price ($) and y = overall score. Brand Price ($) Score A 180 74 B 150 73 C 95 59 D 70 58 E 70 42 F 35 24 (a) Compute SST, SSR, and SSE. (Round your answers to three decimal places.) SST=SSR=SSE= (b) Compute the coefficient of determination r2. (Round your answer to three decimal places.) r2 = Comment on the goodness of fit. (For purposes of this exercise, consider a proportion large if it is at least 0.55.) The least squares line provided a good fit as a small proportion of the variability in y has been explained by the least squares line.The least squares line provided a good fit as a large proportion of…
- The following data give the percentage of women working in five companies in the retail and trade industry. The percentage of management jobs held by women in each company is also shown. %Working 68 45 73 55 62 %Management 50 21 65 47 34 Develop the estimated regression equation by computing the values b 0 and b 1.Enter negative values as negative numbers. Round your answer for the intercept to one decimal place, and your answer for the slope to two decimal places.y^ = + x Predict the percentage of management jobs held by women in a company that has 60% women employees. Round your answer to a whole percentage.The following data on price ($) and the overall score for 6 stereo headphones that were tested by Consumer Reports were as follows. The estimated regression equation for these data is y = 26.239 + 0.309x. (NEED ANSWERS FOR A and C)The following data show the brand, price ($), and the overall score for six stereo headphones that were tested by a certain magazine. The overall score is based on sound quality and effectiveness of ambient noise reduction. Scores range from 0 (lowest) to 100 (highest). The estimated regression equation for these data is ŷ = 25.130 + 0.309x, where x = price ($) and y = overall score. Brand Price($) Score A 180 78 B 150 69 C 95 63 D 70 56 E 70 42 F 35 28 (a) Compute SST, SSR, and SSE. (Round your answers to three decimal places.) SST= SSR= SSE= (b) Compute the coefficient of determination r2. (Round your answer to three decimal places.) Comment on the goodness of fit. (For purposes of this exercise, consider a proportion large if it is at least 0.55.) (c) What is the value of the sample correlation coefficient? (Round your answer to three decimal places.)