The following data were collected in an experiment to study the relationship between extrusion pressure (in KPa) and wear (in mg). | 150 175 200 225 250 275 10.4 12.4 14.9 15.0 13.9 11.9 y The least-squares quadratic model is y = -32.445714 + 0.43154286x – 0.000982857x². Using this equation, compute the residuals. b. Compute the error sum of squares SSE and the total sum of squares SST. Compute the error variance estimate s². a. C. Compute the coefficient of determination R2. Compute the value of the F statistic for the hypothesis Ho : ß1 = B2 = 0. How many degrees of freedom does this statistic have? Can the hypothesis Ho : B1 = B2 = 0 be rejected at the 5% level? Explain. d. e. f.
The following data were collected in an experiment to study the relationship between extrusion pressure (in KPa) and wear (in mg). | 150 175 200 225 250 275 10.4 12.4 14.9 15.0 13.9 11.9 y The least-squares quadratic model is y = -32.445714 + 0.43154286x – 0.000982857x². Using this equation, compute the residuals. b. Compute the error sum of squares SSE and the total sum of squares SST. Compute the error variance estimate s². a. C. Compute the coefficient of determination R2. Compute the value of the F statistic for the hypothesis Ho : ß1 = B2 = 0. How many degrees of freedom does this statistic have? Can the hypothesis Ho : B1 = B2 = 0 be rejected at the 5% level? Explain. d. e. f.

MATLAB: An Introduction with Applications
6th Edition
ISBN:9781119256830
Author:Amos Gilat
Publisher:Amos Gilat
Chapter1: Starting With Matlab
Section: Chapter Questions
Problem 1P

Related questions
Question
100%
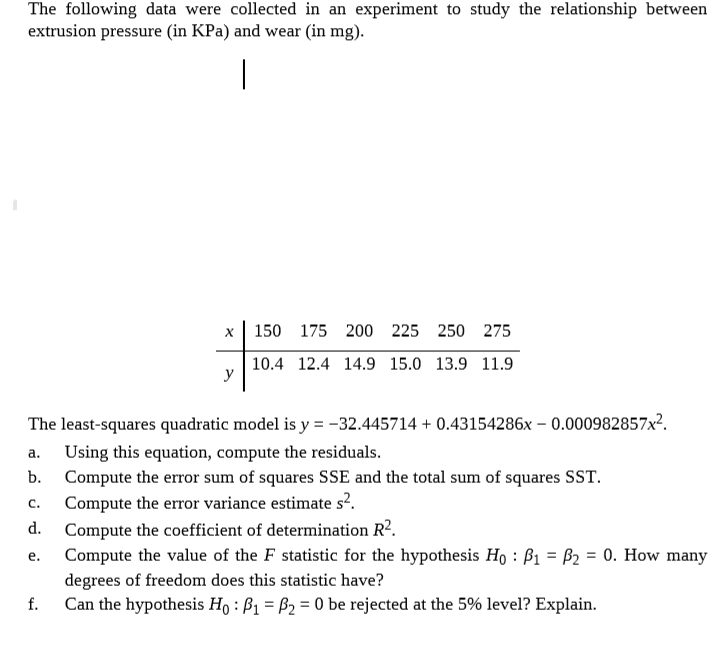
Transcribed Image Text:The following data were collected in an experiment to study the relationship between
extrusion pressure (in KPa) and wear (in mg).
|
150 175 200 225 250 275
10.4 12.4 14.9 15.0 13.9 11.9
y
The least-squares quadratic model is y = -32.445714 + 0.43154286x – 0.000982857x².
Using this equation, compute the residuals.
b. Compute the error sum of squares SSE and the total sum of squares SST.
Compute the error variance estimate s².
a.
C.
Compute the coefficient of determination R2.
Compute the value of the F statistic for the hypothesis Ho : ß1 = B2 = 0. How many
degrees of freedom does this statistic have?
Can the hypothesis Ho : B1 = B2 = 0 be rejected at the 5% level? Explain.
d.
e.
f.
Expert Solution
This question has been solved!
Explore an expertly crafted, step-by-step solution for a thorough understanding of key concepts.

This is a popular solution!

Trending now
This is a popular solution!

Step by step
Solved in 3 steps with 4 images

Recommended textbooks for you
MATLAB: An Introduction with Applications
Statistics
ISBN:
9781119256830
Author:
Amos Gilat
Publisher:
John Wiley & Sons Inc

Probability and Statistics for Engineering and th…
Statistics
ISBN:
9781305251809
Author:
Jay L. Devore
Publisher:
Cengage Learning

Statistics for The Behavioral Sciences (MindTap C…
Statistics
ISBN:
9781305504912
Author:
Frederick J Gravetter, Larry B. Wallnau
Publisher:
Cengage Learning
MATLAB: An Introduction with Applications
Statistics
ISBN:
9781119256830
Author:
Amos Gilat
Publisher:
John Wiley & Sons Inc
Probability and Statistics for Engineering and th…
Statistics
ISBN:
9781305251809
Author:
Jay L. Devore
Publisher:
Cengage Learning
Statistics for The Behavioral Sciences (MindTap C…
Statistics
ISBN:
9781305504912
Author:
Frederick J Gravetter, Larry B. Wallnau
Publisher:
Cengage Learning

Elementary Statistics: Picturing the World (7th E…
Statistics
ISBN:
9780134683416
Author:
Ron Larson, Betsy Farber
Publisher:
PEARSON

The Basic Practice of Statistics
Statistics
ISBN:
9781319042578
Author:
David S. Moore, William I. Notz, Michael A. Fligner
Publisher:
W. H. Freeman

Introduction to the Practice of Statistics
Statistics
ISBN:
9781319013387
Author:
David S. Moore, George P. McCabe, Bruce A. Craig
Publisher:
W. H. Freeman