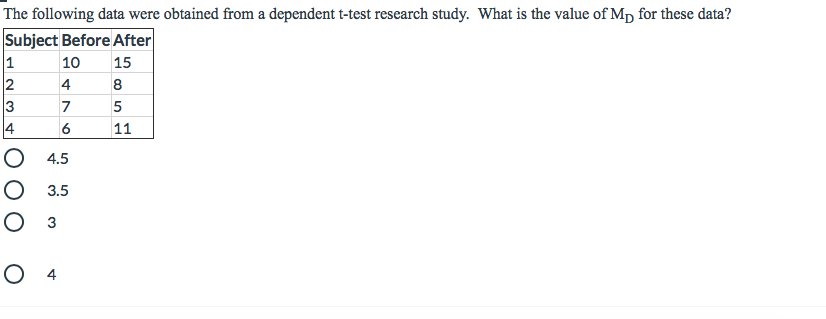
The following data were obtained from a dependent t-test research study. What is the value of Mp for these data? Subject Before After 15 10 4 4 11 4.5 3.5 4 3.


Q: The owner of Showtime Movie Theaters, Inc., would like to predict weekly gross revenue as a function…
A: a) Null and Alternative Hypotheses are given below: Ho : Beta1= Beta2 =0. That is, the overall…
Q: By hand compute the sample correlation coefficient for the following data: 1 9. 10 y 20 18 10 8 4…
A: Correlation is used to find the strength of association between two numerical variables. Each…
Q: The following statement appeared on a box of Tide laundry detergent: “Individual packages of Tide…
A: Given satement : “Individual packages of Tide may weigh slightly more or less than the marked weight…
Q: Here is a bivariate data set. y 51 69 49 54 39 51 51 67 36 39 78 88 38 31 46 55 38 47 Find the…
A: Given that X Y X \cdot YX⋅Y X^2X2 Y^2Y2 51 69 3519 2601 4761 49 54 2646 2401 2916…
Q: 200 Mg 400 Mg Caffeine Caffeine Caffeine Overall No No Alcohol M = 620 M = 600 M = 590 M= 603 %3D…
A:
Q: Use the following data to determine which factor is most predictive of test scores. For each…
A: Solution : Given : Dependent variable : Test Score Independent variables : Sleep, Hr.…
Q: What is the value of r? a) 0.8620 b) -0.8620 c) 0.9236 d) -0.927 e) 0.927 f)…
A: Answer: For the given data,
Q: The data below are from an independent-measures experiment comparing three different treatment…
A: Solution-: We find F-ratio=?
Q: Q6. For the following set of data from five participants showing Hours of Sleep and Results in a…
A: Given data: Hours of sleep Dexterity 7 8 8 8 9 9 10 10 10 15
Q: 1. Calculate the z-statistic and the p-value for each of the following: Po p-value a. 100 0.30 10%…
A: We have given that a) sample size n=100 ,sample proportion p^=0.30, population proportion…
Q: Based on the data below, what is the Cronbach's alpha coefficient? Subject Trial 1 Trial 2 1 5 2 2 3…
A: Given problem Given that Based on the data below, The Cronbach's alpha coefficient is = ?…
Q: Run a regression analysis on the following data set with yas the response variable. x y 75.9 74.1…
A: Use EXCEL to determine the regression equation. EXCEL procedure: Go to EXCEL Go to Data>Data…
Q: Please view the following attached image and answer the multiple choice question
A: We have given two variable x and y. We have to find Sxx We know that-
Q: By hand compute the sample correlation coefficient for the following data: X 1 3 4 9 10 y 20 18 10 4…
A:
Q: A researcher conducts an experiment comparing two methods of teaching young children to read. An…
A: Given information: The given values are: T(120) = 2.10, p-value = 0.04 and d = 0.34.
Q: Find Karl Pearson's coefficient of skewness for the following distribution and comment on the…
A:
Q: Here is a bivariate data set. X 18.5 32.1 32.7 62.1 15.6 62.4 32.7 51 26.6 113.1 Find the…
A:
Q: For each of the following, calculate the z-statistic. (Round your answers to two decimal places.)…
A:
Q: The following data compare a child s age with the number of gymnastic activities child is abl…
A: d) sample mean (x̄) = Σx/n = 38/8 = 4.75 sample mean (ȳ) = Σy/n = 62/8 = 7.75 The equation of…
Q: 3. Construct the scatterplots for the following bivariate data: a. Age of a person, in years 11 12…
A: Plot the points given in the table: Age 11 12 13 14 15 16 17 18 19 20 Weight 40 42 38 35 45 51…
Q: 2. The following figure demonstrate the up-and-down experimental design. Discuss the trend Dose (mg…
A: An up-and-down design is usually used to figure out the dose in any research. For example, in the…
Q: The following data concern the divorce rate (y) per 1,000 women and the percentage of the feme…
A: Given Information: The dependent variable (y) is the divorce rate. The Independent variable (x) is…
Q: 39. From the data given below compute : (a) Coefficient of variation (b) Coefficient of skewness…
A: Purana Sa full song
Q: Consider the following data on x = weight (pounds) and y = price ($) for 10 road-racing bikes Brand…
A: Here, x = weight (pounds) is the independent variable and y = price ($) is the dependent variable.…
Q: Q3. A study was conducted to compare the relative effectiveness of two cough medicines ( A and B) in…
A: As per our company guidelines, we are supposed to answer ?️only the first 3 sub-parts. Kindly repost…
Q: For the data below, compute the Pearson correlation. X Y 1 2 2 3 4 2 5 6 8 7
A: Enter the given data in Excel as follows:
Q: Suppose that the marketing team of a fast-food restaurant wants to have an idea of the effectivity…
A: we know that total probability is equal to…
Q: The following data on price ($) and the overall score for 6 stereo headphones that were tested by…
A: Significance of Regression slope test : t test is used to check the significant relation between two…
Q: Peak heart rate (beats per minute) was determined both during a shuttle run and during a 300-yard…
A:
Q: Q3. A study was conducted to compare the relative effectiveness of two cough medicines ( A and B) in…
A: Since you have posted a question with multiple sub-parts, we will solve first three sub-parts for…
Q: A major credit card company is interested in whether there is a linear relationship between its…
A: Explanation: When we perform hypothesis test in statistics The claim shall be in the alternative…
Q: . (a) Calculate correlation and regression coefficient from the following data: 14 2 6 8 10 12 4 2 5…
A:
Q: Here is a bivariate data set. y 20 61 26 61 19 57 25 48 31 48 24 42 36 35 Find the correlation…
A: Given,
Q: 12 Find out the value of A from the following data, and convert this value of Á into student…
A:
Q: Run a regression analysis on the following bivariate set of data with y as the response variable. y…
A:
Q: From the following data calculate Karl Pearson's coefficient of skewness : 40 80 60 30 70 14 80…
A:
Q: Run a regression analysis on the following bivariate set of data with y as the response variable. x…
A:
Q: sted below are numbers of Internet users per 100 people and numbers of scientific award winners per…
A: Scatter plot is the diagrammatic representation of the bivariate data where one variable is plotted…
Q: Using the data in GPA2 on 4,137 college students, the following equation was estimated by OLS:…
A: Note: Hey there! Thank you for the question. As you have posted a question with multiple sub-parts,…
Q: To measure the relation between the gender and education level, which one is the appropriate…
A:
Q: For a special pre–New Year’s Eve show, a radio station personality has invited a small panel of…
A: In this scenario, it is appropriate to use paired t test. Null and alternative Hypothesis for the…
Q: Calculate the z-statistic and the p-value for each of the following: Po p-value a. 100 0.30 10% b.…
A: Comments: As per our guidelines we are supposed to answer only three subparts. Kindly repost other…
Q: The following table reports the sale of umbrellas for 16 quarters. Year 1 Year 2 Year 3 Year 4…
A: When we want to estimate an impact of many variables on the one variable at that time we…
Q: In baseball, is there a linear correlation between batting average and home run percentage? Let x…
A: From the given information, x y x^2 y^2 xy 0.243 1 0.059049 1 0.243…
Q: From the following data calculate Karl Pearson's coefficient of skewness. Marks:
A:
Q: The following data were obtained from a dependent t-test research study. What is the value of MD…
A:
Q: A group of 5 cancer patients were subjected to drug treatment. The observations before and after…
A:
Q: Here is a bivariate data set. x -10.8 35.2 38.8 30.9 37.5 35.3 y 87.2 65.4 138.4 54 17.7 29.4 Find…
A:

Step by step
Solved in 2 steps with 2 images

- The following data were obtained from a dependent t-test research study. What is the value of MD for these data?Two samples, each with n = 9 scores, produce an independent-measures t statistic of t = 2.00. If the effect size is measured using r2, what is the value of r2?A researcher conducted a t-test for independent samples to evaluate the mean difference between two treatment conditions and obtained t(48) = 4.00. What would be the computed F, if the outcomes of this study were evaluated by one-actor ANOVA for independent samples?
- For a special pre–New Year’s Eve show, a radio station personality has invited a small panel of prominent local citizens to help demonstrate to listeners the adverse effect of alcohol on reaction time. The reaction times (in seconds) before and after consuming four drinks are in data below. At the 0.005 level, has the program host made his point? Identify and interpret the p-value for the test. Data: Subject Before After 1 0.32 0.39 2 0.39 0.44 3 0.36 0.49 4 0.41 0.53 5 0.37 0.46 6 0.42 0.52 7 0.41 0.52 8 0.43 0.46 9 0.39 0.55 10 0.41 0.52 11 0.35 0.45 12 0.42 0.41 13 0.32 0.54 14 0.39 0.46 15 0.41 0.53 16 0.33 0.54 17 0.43 0.46 18 0.42 0.43 19 0.41 0.52 20 0.35 0.52 21 0.39 0.41 22 0.39 0.44 23 0.32 0.50 24 0.33 0.53 25 0.31 0.45 26 0.35 0.45 27 0.31 0.45 28 0.32 0.48 29 0.38 0.54 30 0.37 0.46 31 0.39 0.49 32 0.30 0.51 33 0.40 0.49 34 0.41 0.50 35 0.41 0.53 36 0.35 0.47 37 0.37 0.51 38 0.41 0.46A researcher conducts an independent-measure study comparing two treatments and reports the t statistic as t(25) = 2.071 How many individuals participated in the entire study? Using a two-tailed test with a= 0.5, is there a significant difference between the two treatments?A researcher conducts an independent-measures study comparing two treatments and reports the t statistic as t(30) = 2.085. How many individuals participated in the entire study? Using a two-tailed test with α = .05, is there a significant difference between the two treatments?
- Interpret the following statement regarding the statistical findings of a research study. “61% (n = 36) of recipients of the low-carbohydrate diet and 23% (n = 14) of recipients of the low-fat diet completed the study and lost greater than 10% of their initial body weight (P < 0.001).” Number of participants who completed the study and lost greater than 10% of their body weight: P-value: Does this p-value indicate a statistically-significant difference in the average weight loss between the two groups:A two-sided t-test for a population mean is conducted with H0: = 80. If a 99 percent t-interval constructedfrom the same sample data contains the value of 80, which of the following can be concluded about thehypothesis test at significance level of = 0.01?The following SPSS output examines the percent of security staff that is female at private and public prisons. Based on the output answer the question below. Assuming the difference was significant, what is the effect size based on a calculated r2? A small difference between the prisons A moderate difference between the prisons A large difference between the prisons
- The following data are from a random sample of 10 students who participated in a study undertaken to investigate the effect of sleep time (measured in average number of hours of sleep per night) on GPA (grade point average, measured on a 4-point scale). Student Sleep time GPA 1 7 3.28 2 9 3.16 3 8 3.75 4 6 2.50 5 4 2.45 6 8 2.91 7 7 3.53 8 6 3.02 9 3 2.30 10 8 3.48 a. Find the equation between GPA (y) as function of sleep time (x). b. What is the estimated GPA of a student who averages 5 hours of sleep per night? c. What is the coefficient of determination? *(no use EXCEL)Below is bivariate data on vintage dresser auctions, where X is the year of construction of the dresser and Y is the price sold at auction. Answer the following questions below using evidence.A researcher is interested in hamster wheel-running activity during the summer versus the winter. He suspects that either the hamsters will run less during the winter to conserve energy or they will run more to keep warm. He records the activity of n = 16 hamsters during June, July, and August and compares their running-wheel revolutions per hour to the activity of the same hamsters during December, January, and February. The data are collected, and the results show an average difference score of MDD = 3.8 and a sum of squares of SS = 522.15. What is the value for degrees of freedom for this repeated-measures t test? 47 15 50 16 What is the sample standard deviation (s) for the D scores? 1.48 5.9 522.15 34.81 What is the estimated standard error of the mean difference (sMDMD) for this study? 0.37 2.18 1.48 1.22