The following graph gives two points (A and B) along a hypothetical demand curve for seitan. PRICE (Dollars per pound) 12 11 10 9 3 2 1 0 0 70, 3 I B A Demand 10 20 30 40 50 60 70 80 90 100 110 QUANTITY (Thousands of pounds of seitan) ? Using the midpoint method, the price elasticity of demand for seitan between point A and point B is approximately for seitan is between points A and B. This indicates that demand
The following graph gives two points (A and B) along a hypothetical demand curve for seitan. PRICE (Dollars per pound) 12 11 10 9 3 2 1 0 0 70, 3 I B A Demand 10 20 30 40 50 60 70 80 90 100 110 QUANTITY (Thousands of pounds of seitan) ? Using the midpoint method, the price elasticity of demand for seitan between point A and point B is approximately for seitan is between points A and B. This indicates that demand

Chapter5: Elasticity Of Demand And Supply
Section: Chapter Questions
Problem 1.1P: (Calculating Price Elasticity of Demand) Suppose that 50 units of a good are demanded at a price of...

Related questions
Question
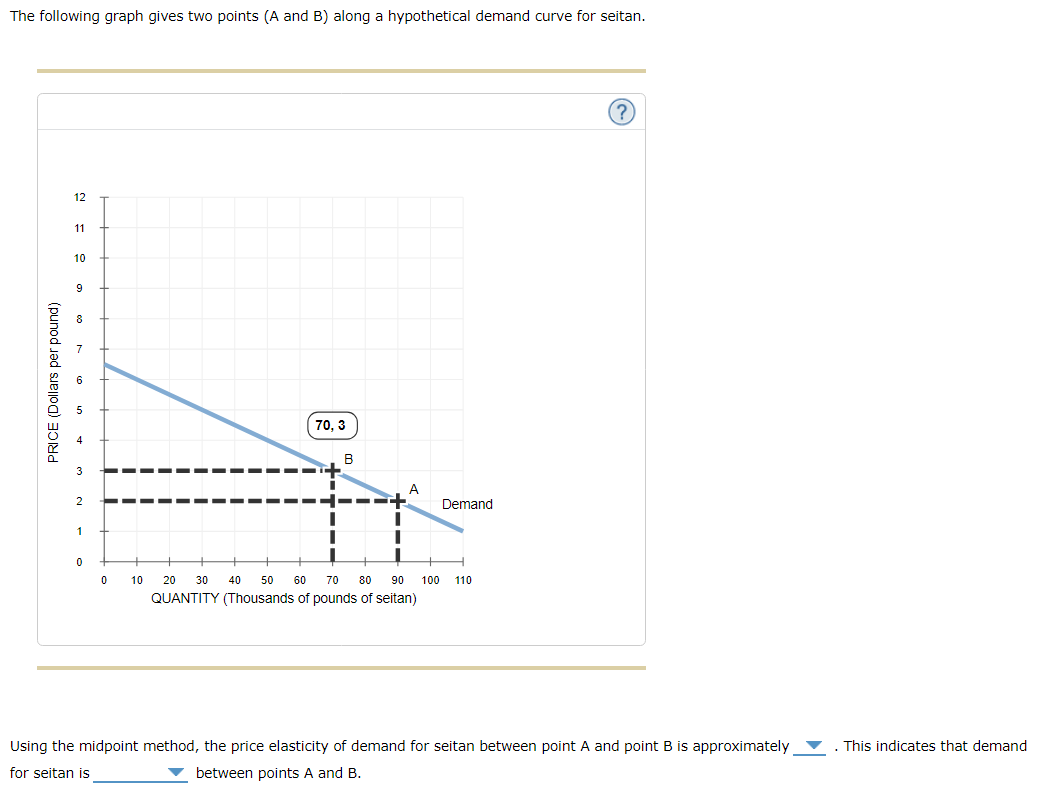
Transcribed Image Text:The following graph gives two points (A and B) along a hypothetical demand curve for seitan.
PRICE (Dollars per pound)
12
11
10
9
3
2
1
0
0
70, 3
I
B
A
Demand
10 20 30 40 50 60 70 80 90 100 110
QUANTITY (Thousands of pounds of seitan)
?
Using the midpoint method, the price elasticity of demand for seitan between point A and point B is approximately
for seitan is
between points A and B.
This indicates that demand
Expert Solution
This question has been solved!
Explore an expertly crafted, step-by-step solution for a thorough understanding of key concepts.

This is a popular solution!

Trending now
This is a popular solution!

Step by step
Solved in 3 steps

Knowledge Booster


Learn more about
Need a deep-dive on the concept behind this application? Look no further. Learn more about this topic, economics and related others by exploring similar questions and additional content below.Recommended textbooks for you

Managerial Economics: Applications, Strategies an…
Economics
ISBN:
9781305506381
Author:
James R. McGuigan, R. Charles Moyer, Frederick H.deB. Harris
Publisher:
Cengage Learning

Managerial Economics: Applications, Strategies an…
Economics
ISBN:
9781305506381
Author:
James R. McGuigan, R. Charles Moyer, Frederick H.deB. Harris
Publisher:
Cengage Learning


Exploring Economics
Economics
ISBN:
9781544336329
Author:
Robert L. Sexton
Publisher:
SAGE Publications, Inc