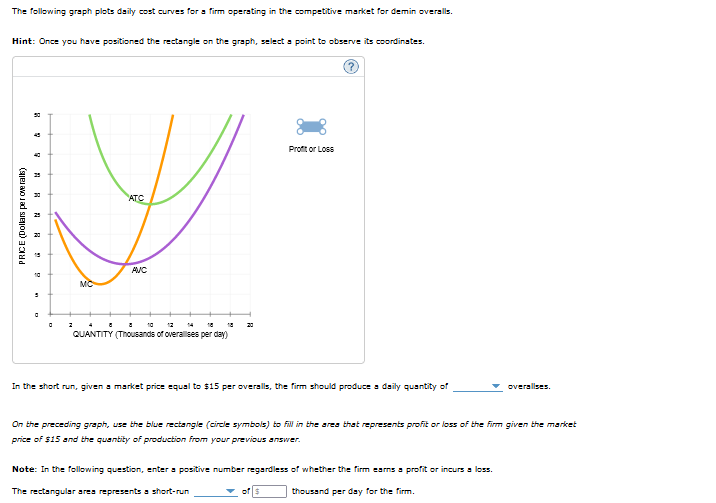
The following graph plots daily cost curves for a firm operating in the competitive market for demin overalls. Hint: Once you have positioned the rectangle on the graph, select a point to observe its coordinates. PRICE (Dollars per overalls) 50 & 10 5 a H MC 2 ATC 8 4 10 QUANTITY (Thousands of overallises per day) AVC 20 Profit or Loss In the short run, given a market price equal to $15 per overalls, the firm should produce a daily quantity of overallses. On the preceding graph, use the blue rectangle (circle symbols) to fill in the area that represents profit or loss of the firm given the market price of $15 and the quantity of production from your previous answer. Note: In the following question, enter a positive number regardless of whether the firm earns a profit or incurs a loss. The rectangular area represents a short-run thousand per day for the firm.
The following graph plots daily cost curves for a firm operating in the competitive market for demin overalls. Hint: Once you have positioned the rectangle on the graph, select a point to observe its coordinates. PRICE (Dollars per overalls) 50 & 10 5 a H MC 2 ATC 8 4 10 QUANTITY (Thousands of overallises per day) AVC 20 Profit or Loss In the short run, given a market price equal to $15 per overalls, the firm should produce a daily quantity of overallses. On the preceding graph, use the blue rectangle (circle symbols) to fill in the area that represents profit or loss of the firm given the market price of $15 and the quantity of production from your previous answer. Note: In the following question, enter a positive number regardless of whether the firm earns a profit or incurs a loss. The rectangular area represents a short-run thousand per day for the firm.

Microeconomics: Principles & Policy
14th Edition
ISBN:9781337794992
Author:William J. Baumol, Alan S. Blinder, John L. Solow
Publisher:William J. Baumol, Alan S. Blinder, John L. Solow
Chapter7: Production, Inputs, And Cost: Building Blocks For Supply Analysis
Section: Chapter Questions
Problem 1DQ

Related questions
Question
Transcribed Image Text:The following graph plots daily cost curves for a firm operating in the competitive market for demin overalls.
Hint: Once you have positioned the rectangle on the graph, select a point to observe its coordinates.
PRICE (Dollars per overalls)
50
10
10
5
0
MC
2
ATC
8
18
QUANTITY (Thousands of overallises per day)
AVC
10
20
Profit or Loss
In the short run, given a market price equal to $15 per overalls, the firm should produce a daily quantity of
On the preceding graph, use the blue rectangle (circle symbols) to fill in the area that represents profit or loss of the firm given the market
price of $15 and the quantity of production from your previous answer.
Note: In the following question, enter a positive number regardless of whether the firm earns a profit or incurs a loss.
The rectangular area represents a short-run
thousand per day for the firm.
$
overallses.
Expert Solution
This question has been solved!
Explore an expertly crafted, step-by-step solution for a thorough understanding of key concepts.

This is a popular solution!

Trending now
This is a popular solution!

Step by step
Solved in 3 steps with 1 images

Knowledge Booster


Learn more about
Need a deep-dive on the concept behind this application? Look no further. Learn more about this topic, economics and related others by exploring similar questions and additional content below.Recommended textbooks for you
Microeconomics: Principles & Policy
Economics
ISBN:
9781337794992
Author:
William J. Baumol, Alan S. Blinder, John L. Solow
Publisher:
Cengage Learning


Managerial Economics: A Problem Solving Approach
Economics
ISBN:
9781337106665
Author:
Luke M. Froeb, Brian T. McCann, Michael R. Ward, Mike Shor
Publisher:
Cengage Learning
Microeconomics: Principles & Policy
Economics
ISBN:
9781337794992
Author:
William J. Baumol, Alan S. Blinder, John L. Solow
Publisher:
Cengage Learning
Managerial Economics: A Problem Solving Approach
Economics
ISBN:
9781337106665
Author:
Luke M. Froeb, Brian T. McCann, Michael R. Ward, Mike Shor
Publisher:
Cengage Learning


