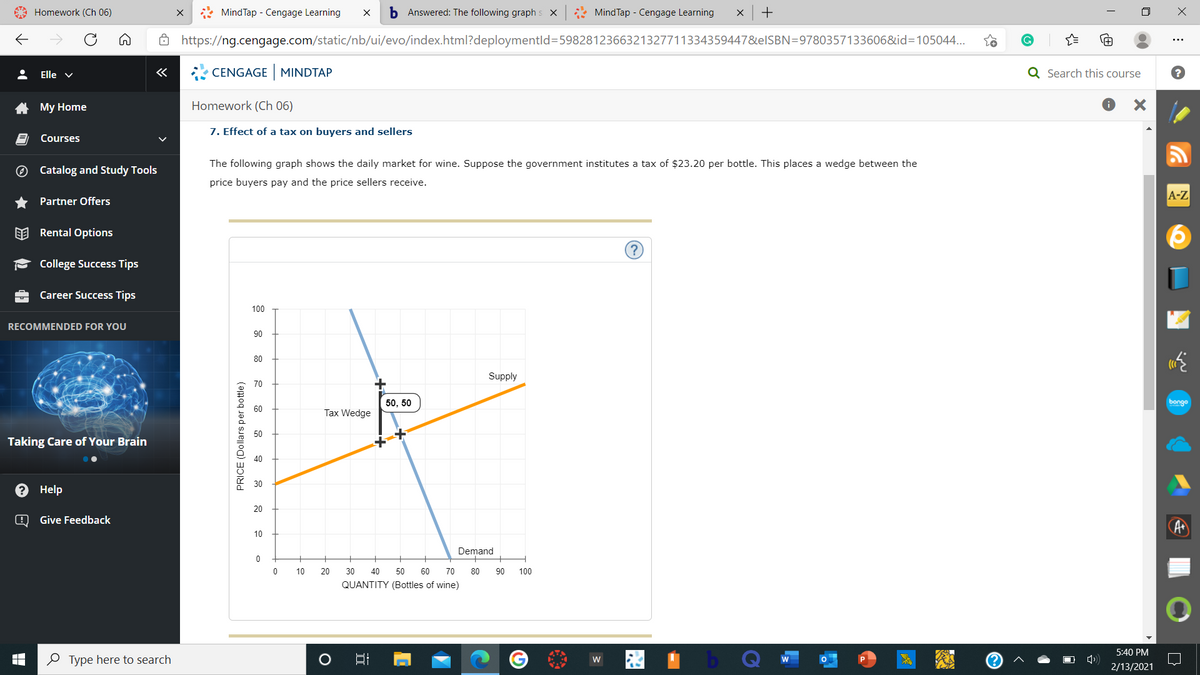
The following graph shows the daily market for wine. Suppose the government institutes a tax of $23.20 per bottle. This places a wedge between the price buyers pay and the price sellers receive. Fill in the following table with the quantity sold, the price buyers pay, and the price sellers receive before and after the tax. Using the data you entered in the previous table, calculate the tax burden that falls on buyers and on sellers, respectively, and calculate the price elasticity of demand and supply over the relevant ranges using the midpoint method. Enter your results in the following table.
The following graph shows the daily market for wine. Suppose the government institutes a tax of $23.20 per bottle. This places a wedge between the price buyers pay and the price sellers receive. Fill in the following table with the quantity sold, the price buyers pay, and the price sellers receive before and after the tax. Using the data you entered in the previous table, calculate the tax burden that falls on buyers and on sellers, respectively, and calculate the price elasticity of demand and supply over the relevant ranges using the midpoint method. Enter your results in the following table.

Managerial Economics: Applications, Strategies and Tactics (MindTap Course List)
14th Edition
ISBN:9781305506381
Author:James R. McGuigan, R. Charles Moyer, Frederick H.deB. Harris
Publisher:James R. McGuigan, R. Charles Moyer, Frederick H.deB. Harris
Chapter2: Fundamental Economic Concepts
Section: Chapter Questions
Problem 4E

Related questions
Question
The following graph shows the daily market for wine. Suppose the government institutes a tax of $23.20 per bottle. This places a wedge between the price buyers pay and the price sellers receive.
Fill in the following table with the quantity sold, the price buyers pay, and the price sellers receive before and after the tax.
Using the data you entered in the previous table, calculate the tax burden that falls on buyers and on sellers, respectively, and calculate the price elasticity of demand and supply over the relevant ranges using the midpoint method. Enter your results in the following table.
The burden of the tax falls more heavily on the ___ elastic side of the market.
Transcribed Image Text:A Homework (Ch 06)
* MindTap - Cengage Learning
b Answered: The following graph s X
* MindTap - Cengage Learning
+
8 https://ng.cengage.com/static/nb/ui/evo/index.html?deploymentld=5982812366321327711334359447&elSBN=9780357133606&id=105044...
Elle v
CENGAGE MINDTAP
Q Search this course
A My Home
Homework (Ch 06)
7. Effect of a tax on buyers and sellers
Courses
The following graph shows the daily market for wine. Suppose the government institutes a tax of $23.20 per bottle. This places a wedge between the
O Catalog and Study Tools
price buyers pay and the price sellers receive.
A-Z
Partner Offers
EE Rental Options
College Success Tips
Career Success Tips
100
RECOMMENDED FOR YOU
90
80
Supply
70
50, 50
bongo
60
Tax Wedge
50
Taking Care of Your Brain
40
30
Help
20
Give Feedback
10
Demand
10
20
30
40
50
60
70
80
90
100
QUANTITY (Bottles of wine)
5:40 PM
O Type here to search
W
2/13/2021
PRICE (Dollars per bottle)
Expert Solution
This question has been solved!
Explore an expertly crafted, step-by-step solution for a thorough understanding of key concepts.

This is a popular solution!

Trending now
This is a popular solution!

Step by step
Solved in 3 steps

Knowledge Booster


Learn more about
Need a deep-dive on the concept behind this application? Look no further. Learn more about this topic, economics and related others by exploring similar questions and additional content below.Recommended textbooks for you
Managerial Economics: Applications, Strategies an…
Economics
ISBN:
9781305506381
Author:
James R. McGuigan, R. Charles Moyer, Frederick H.deB. Harris
Publisher:
Cengage Learning
Managerial Economics: Applications, Strategies an…
Economics
ISBN:
9781305506381
Author:
James R. McGuigan, R. Charles Moyer, Frederick H.deB. Harris
Publisher:
Cengage Learning