The following graph shows the market for cakes in San Francisco, where there are over 1,000 bakeries at any given moment. Suppose the number of bakeries increases significantly. ols Show the effect of this change on the market for cakes by shifting one or both of the curves on the following graph, holding all else constant. Note: Select and drag one or both of the curves to the desired position, Curves will snap into position, so if you try to move a curve and it snaps back to its original position, just drag it a little farther, (?) O Supply Demand Supply Demand QUANTITY (Cakes) PRICE (Dollars per cake)
The following graph shows the market for cakes in San Francisco, where there are over 1,000 bakeries at any given moment. Suppose the number of bakeries increases significantly. ols Show the effect of this change on the market for cakes by shifting one or both of the curves on the following graph, holding all else constant. Note: Select and drag one or both of the curves to the desired position, Curves will snap into position, so if you try to move a curve and it snaps back to its original position, just drag it a little farther, (?) O Supply Demand Supply Demand QUANTITY (Cakes) PRICE (Dollars per cake)

Economics Today and Tomorrow, Student Edition
1st Edition
ISBN:9780078747663
Author:McGraw-Hill
Publisher:McGraw-Hill
Chapter7: Demand And Supply
Section: Chapter Questions
Problem 20AA

Related questions
Question
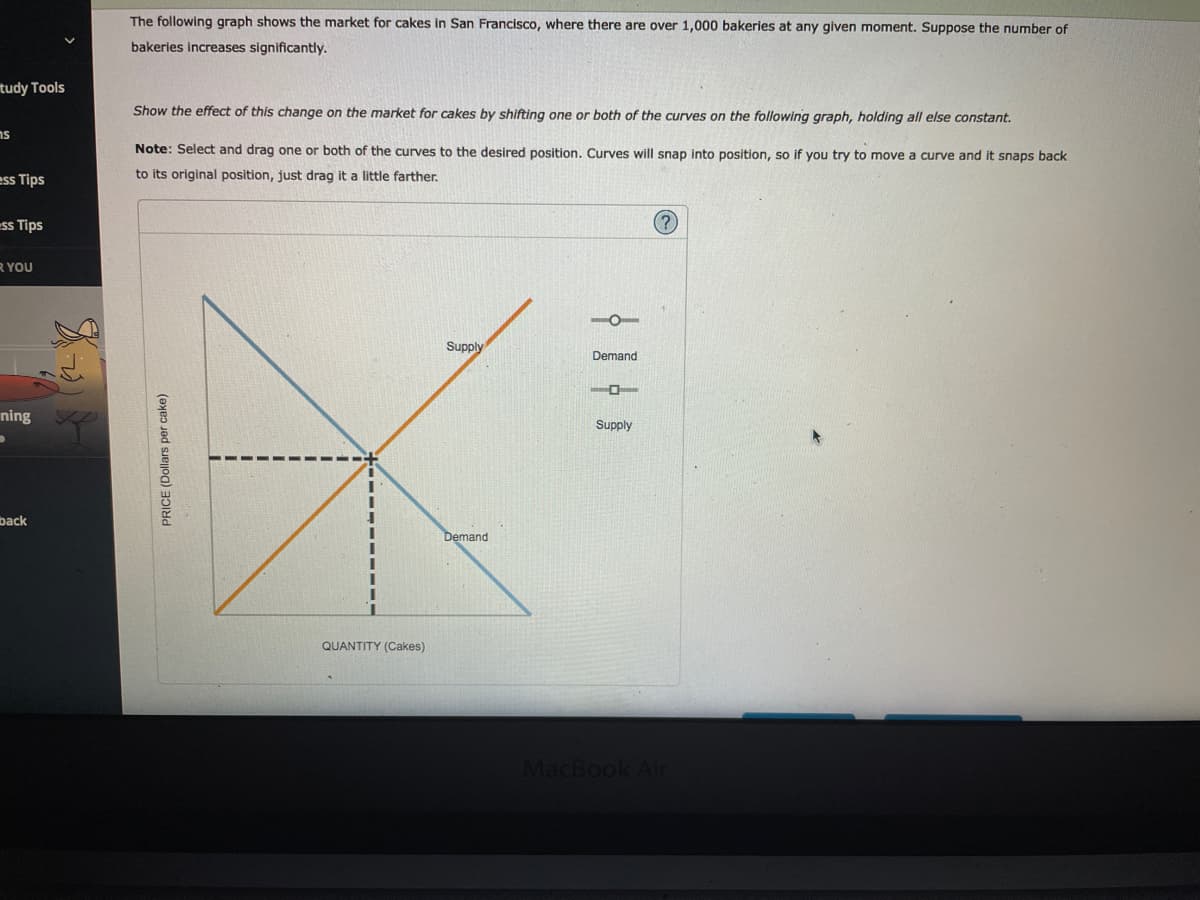
Transcribed Image Text:The following graph shows the market for cakes in San Francisco, where there are over 1,000 bakeries at any given moment. Suppose the number of
bakeries increases significantly.
tudy Tools
Show the effect of this change on the market for cakes by shifting one or both of the curves on the following graph, holding all else constant.
ns
Note: Select and drag one or both of the curves to the desired position. Curves will snap into position, so if you try to move
curve and it snaps back
ess Tips
to its original position, just drag it a little farther.
ess Tips
(?)
R YOU
Supply
Demand
ning
Supply
back
Demand
QUANTITY (Cakes)
MacBook Air
PRICE (Dollars per cake)
Expert Solution
Step 1
Supply curve shows quantity supplied by producers at various prices. It slopes upward. When number of suppliers increase, the market output increases.

Trending now
This is a popular solution!

Step by step
Solved in 2 steps with 1 images

Knowledge Booster


Learn more about
Need a deep-dive on the concept behind this application? Look no further. Learn more about this topic, economics and related others by exploring similar questions and additional content below.Recommended textbooks for you
Economics Today and Tomorrow, Student Edition
Economics
ISBN:
9780078747663
Author:
McGraw-Hill
Publisher:
Glencoe/McGraw-Hill School Pub Co

Exploring Economics
Economics
ISBN:
9781544336329
Author:
Robert L. Sexton
Publisher:
SAGE Publications, Inc

Principles of Economics 2e
Economics
ISBN:
9781947172364
Author:
Steven A. Greenlaw; David Shapiro
Publisher:
OpenStax
Economics Today and Tomorrow, Student Edition
Economics
ISBN:
9780078747663
Author:
McGraw-Hill
Publisher:
Glencoe/McGraw-Hill School Pub Co
Exploring Economics
Economics
ISBN:
9781544336329
Author:
Robert L. Sexton
Publisher:
SAGE Publications, Inc
Principles of Economics 2e
Economics
ISBN:
9781947172364
Author:
Steven A. Greenlaw; David Shapiro
Publisher:
OpenStax

Economics (MindTap Course List)
Economics
ISBN:
9781337617383
Author:
Roger A. Arnold
Publisher:
Cengage Learning


Essentials of Economics (MindTap Course List)
Economics
ISBN:
9781337091992
Author:
N. Gregory Mankiw
Publisher:
Cengage Learning