The following graph shows the market for hamburgers in Detroit, where there are over 1,000 burger joints at any given moment. Suppose an innovation in meat processing technology makes it possible to produce more hamburgers at a lower cost than ever before. Show the efect of this change on the market for hamburgers by shifting one or both of the curves on the following graph, holding all else constant. Note: Select and drag one or both of the curves to the desired position. Curves will snap into position, so if you try to move a curve and it snaps back to its original position, just drag it a little farther. Supply Demand Supply Demand QUANTITY (Hamburgers) PRICE (Dolars per hamburger)
The following graph shows the market for hamburgers in Detroit, where there are over 1,000 burger joints at any given moment. Suppose an innovation in meat processing technology makes it possible to produce more hamburgers at a lower cost than ever before. Show the efect of this change on the market for hamburgers by shifting one or both of the curves on the following graph, holding all else constant. Note: Select and drag one or both of the curves to the desired position. Curves will snap into position, so if you try to move a curve and it snaps back to its original position, just drag it a little farther. Supply Demand Supply Demand QUANTITY (Hamburgers) PRICE (Dolars per hamburger)

Chapter5: Markets In Motion And Price Controls
Section: Chapter Questions
Problem 10P

Related questions
Question
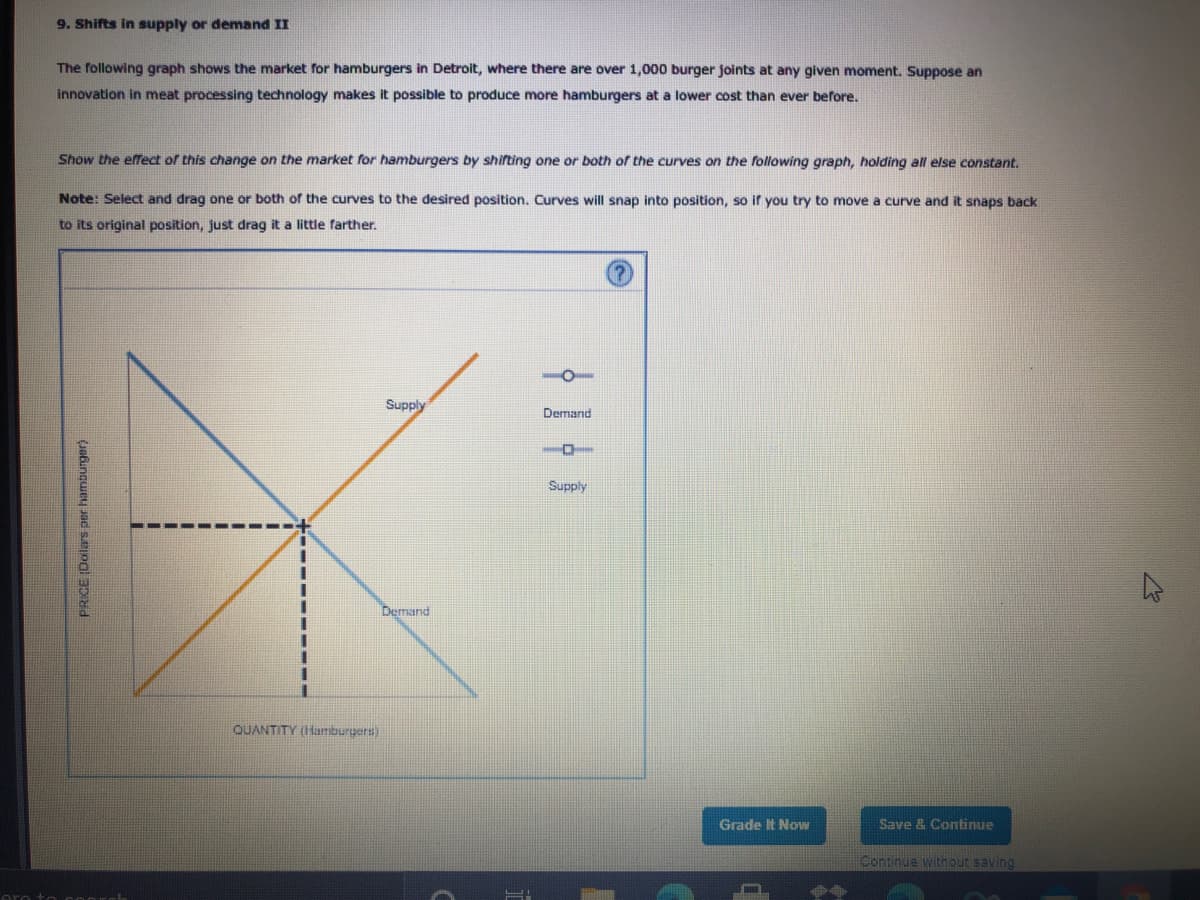
Transcribed Image Text:The following graph shows the market for hamburgers in Detroit, where there are over 1,000 burger joints at any given moment. Suppose an
innovation in meat processing technology makes it possible to produce more hamburgers at a lower cost than ever before.
Show the efect of this change on the market for hamburgers by shifting one or both of the curves on the following graph, holding all else constant.
Note: Select and drag one or both of the curves to the desired position. Curves will snap into position, so if you try to move a curve and it snaps back
to its original position, just drag it a little farther.
Supply
Demand
Supply
Demand
QUANTITY (Hamburgers)
PRICE (Dolars per hamburger)
Expert Solution
This question has been solved!
Explore an expertly crafted, step-by-step solution for a thorough understanding of key concepts.

This is a popular solution!

Trending now
This is a popular solution!

Step by step
Solved in 2 steps with 1 images

Knowledge Booster


Learn more about
Need a deep-dive on the concept behind this application? Look no further. Learn more about this topic, economics and related others by exploring similar questions and additional content below.Recommended textbooks for you
Exploring Economics
Economics
ISBN:
9781544336329
Author:
Robert L. Sexton
Publisher:
SAGE Publications, Inc

Principles of Economics 2e
Economics
ISBN:
9781947172364
Author:
Steven A. Greenlaw; David Shapiro
Publisher:
OpenStax

Exploring Economics
Economics
ISBN:
9781544336329
Author:
Robert L. Sexton
Publisher:
SAGE Publications, Inc
Principles of Economics 2e
Economics
ISBN:
9781947172364
Author:
Steven A. Greenlaw; David Shapiro
Publisher:
OpenStax
