The following graph shows the production possibilities frontier (PPF) of an economy that produces food and coal. The black points (cross symbols represent three possible output levels in a given month. (Hint: You can click on the points to see their exact coordinates.) Refer to the following graph to answer the questions that follow. FOOD (Thousands of pounds) 16 14 12 10 8 6 2 0 + 0 PPF 40 80 C + B + 120 160 200 COAL (Millions of tons) 240 280 320 ? Suppose the economy initially produces 6,000 pounds of food and 200 million tons of coal, which is represented by point A. The opportunity cost of producing an additional 2,000 pounds of food (that is, moving production to point B) is tons of coal.
The following graph shows the production possibilities frontier (PPF) of an economy that produces food and coal. The black points (cross symbols represent three possible output levels in a given month. (Hint: You can click on the points to see their exact coordinates.) Refer to the following graph to answer the questions that follow. FOOD (Thousands of pounds) 16 14 12 10 8 6 2 0 + 0 PPF 40 80 C + B + 120 160 200 COAL (Millions of tons) 240 280 320 ? Suppose the economy initially produces 6,000 pounds of food and 200 million tons of coal, which is represented by point A. The opportunity cost of producing an additional 2,000 pounds of food (that is, moving production to point B) is tons of coal.

Chapter2: Economic Tools And Economic Systems
Section: Chapter Questions
Problem 3.5P

Related questions
Question
Unsure how to solve
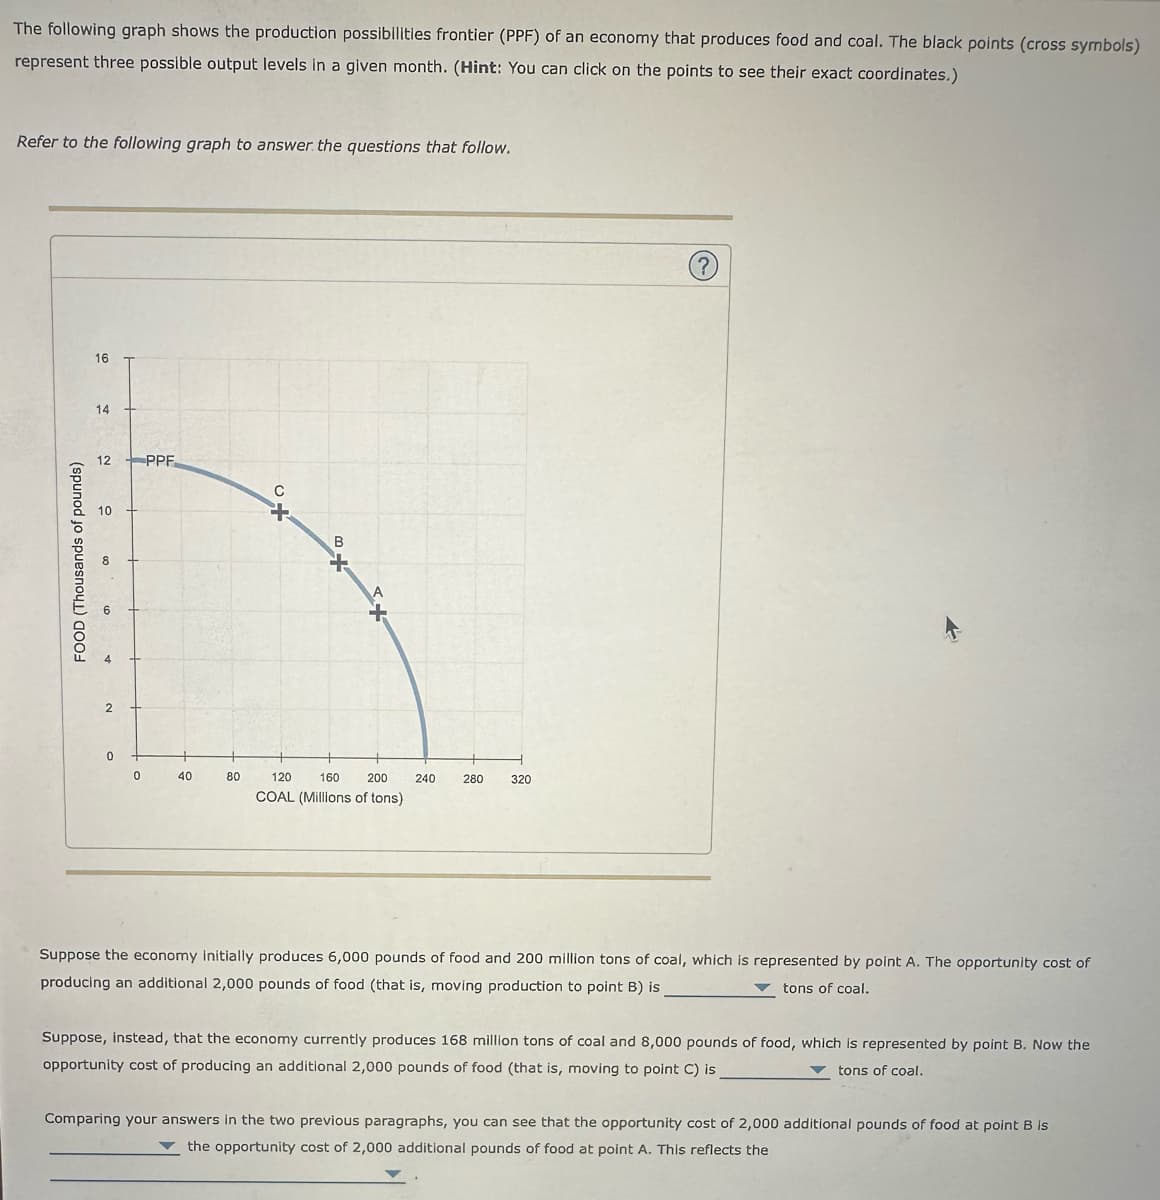
Transcribed Image Text:The following graph shows the production possibilities frontier (PPF) of an economy that produces food and coal. The black points (cross symbols)
represent three possible output levels in a given month. (Hint: You can click on the points to see their exact coordinates.)
Refer to the following graph to answer the questions that follow.
FOOD (Thousands of pounds)
3
16
A
14
12
10
8
2
0
0
PPF
40
80
C
B
+
120
160 200
COAL (Millions of tons)
240 280
320
?
Suppose the economy initially produces 6,000 pounds of food and 200 million tons of coal, which is represented by point A. The opportunity cost of
producing an additional 2,000 pounds of food (that is, moving production to point B) is
tons of coal.
Suppose, instead, that the economy currently produces 168 million tons of coal and 8,000 pounds of food, which is represented by point B. Now the
opportunity cost of producing an additional 2,000 pounds of food (that is, moving to point C) is
tons of coal.
Comparing your answers in the two previous paragraphs, you can see that the opportunity cost of 2,000 additional pounds of food at point B is
the opportunity cost of 2,000 additional pounds of food at point A. This reflects the
Expert Solution
This question has been solved!
Explore an expertly crafted, step-by-step solution for a thorough understanding of key concepts.

This is a popular solution!

Trending now
This is a popular solution!

Step by step
Solved in 2 steps

Knowledge Booster


Learn more about
Need a deep-dive on the concept behind this application? Look no further. Learn more about this topic, economics and related others by exploring similar questions and additional content below.Recommended textbooks for you


Exploring Economics
Economics
ISBN:
9781544336329
Author:
Robert L. Sexton
Publisher:
SAGE Publications, Inc