The following graph shows the short-run average total cost curves and the long-run average total cost curve for a publishing firm. The five marked quantities indicate points of tangency between each short-run average total cost curve (ATC) and the long-run average total cost curve (LRATC); for example, Qi marks the point of tangency between ATC and LRATC. The orange point on ATC3 indicates the firm's current output level in the short run (Q3). ATC, ATC, LRATO ATC2 ATC, ATC, 3D Q, OUTPUT COST PER UNIT
The following graph shows the short-run average total cost curves and the long-run average total cost curve for a publishing firm. The five marked quantities indicate points of tangency between each short-run average total cost curve (ATC) and the long-run average total cost curve (LRATC); for example, Qi marks the point of tangency between ATC and LRATC. The orange point on ATC3 indicates the firm's current output level in the short run (Q3). ATC, ATC, LRATO ATC2 ATC, ATC, 3D Q, OUTPUT COST PER UNIT

Chapter11: The Firm: Production And Costs
Section: Chapter Questions
Problem 17P

Related questions
Question
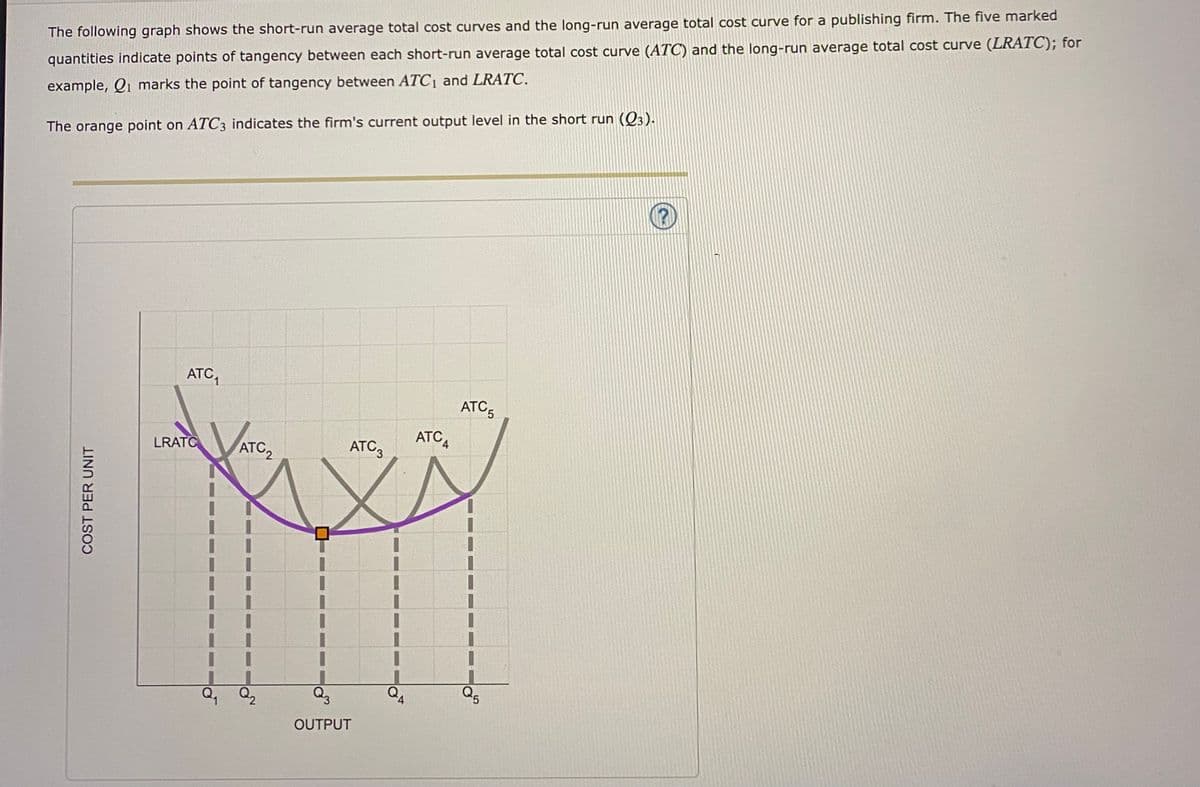
Transcribed Image Text:The following graph shows the short-run average total cost curves and the long-run average total cost curve for a publishing firm. The five marked
quantities indicate points of tangency between each short-run average total cost curve (ATC) and the long-run average total cost curve (LRATC); for
example, Qi marks the point of tangency between ATCı and LRATC.
The orange point on ATC3 indicates the firm's current output level in the short run (Q3).
ATC,
ATC5
LRATC
ATC,
ATC3
ATC4
3D
Q,
OUTPUT
COST PER UNIT
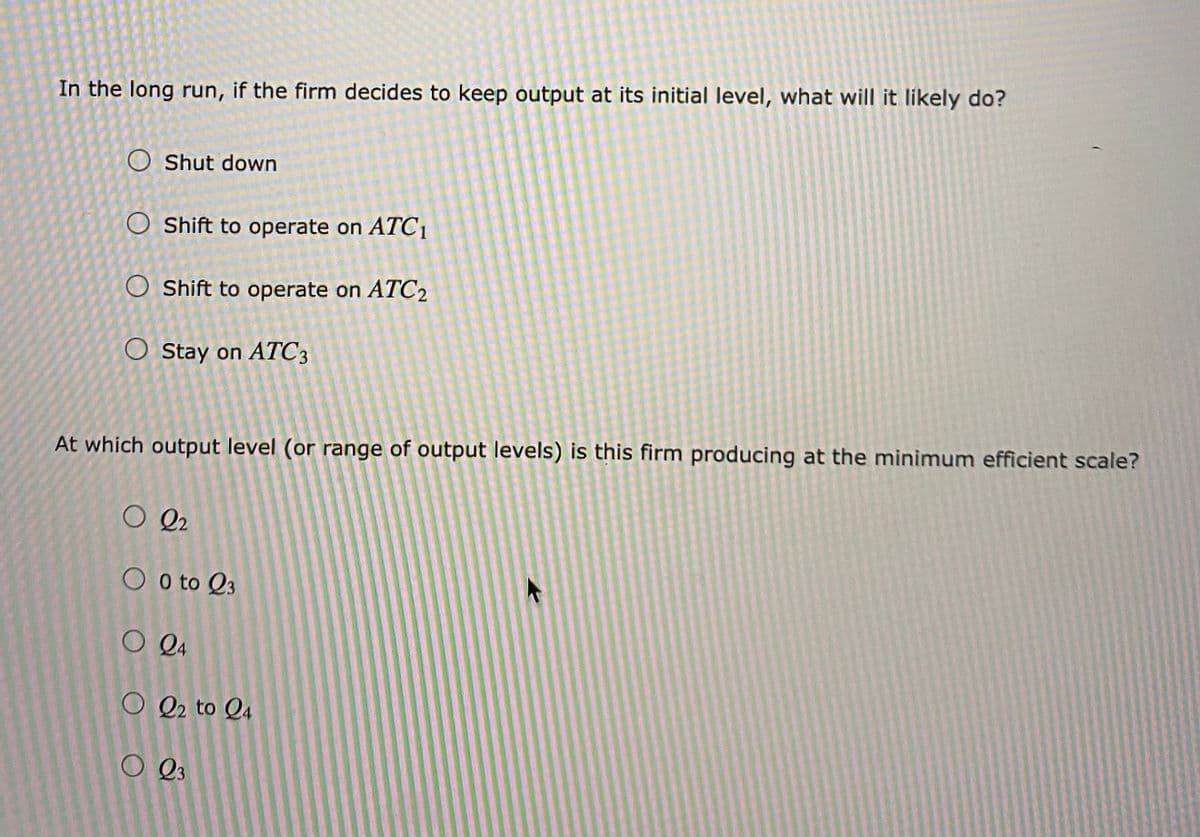
Transcribed Image Text:In the long run, if the firm decides to keep output at its initial level, what will it likely do?
Shut down
O Shift to operate on ATC1
O Shift to operate on ATC2
O Stay on ATC3
At which output level (or range of output levels) is this firm producing at the minimum efficient scale?
O Q2
O o to Q3
O Q4
O 2 to Q4
O Q3
Expert Solution
This question has been solved!
Explore an expertly crafted, step-by-step solution for a thorough understanding of key concepts.

This is a popular solution!

Trending now
This is a popular solution!

Step by step
Solved in 2 steps

Recommended textbooks for you
Exploring Economics
Economics
ISBN:
9781544336329
Author:
Robert L. Sexton
Publisher:
SAGE Publications, Inc


Exploring Economics
Economics
ISBN:
9781544336329
Author:
Robert L. Sexton
Publisher:
SAGE Publications, Inc


Managerial Economics: A Problem Solving Approach
Economics
ISBN:
9781337106665
Author:
Luke M. Froeb, Brian T. McCann, Michael R. Ward, Mike Shor
Publisher:
Cengage Learning

Essentials of Economics (MindTap Course List)
Economics
ISBN:
9781337091992
Author:
N. Gregory Mankiw
Publisher:
Cengage Learning