The following histogram represents the number of children visiting the park in evening at different time intervals: y 50 45+ 40 35 30 25 20 15+ 10 4:30 5 5:30 6. 6:30 7 7:30 Time- Answer the following questions by looking at the histogram. i) How many children visited the park between 4 p.m. to 6 p.m.? ii) At what time the maximum number of children visited the park? iii) How many children visited the park before 7 p.m.? iv) How many children visited the park after 5 p.m.? v) What are the total number of children visited the park in the evening? vi) How many children visited the park before 4 p.m.? vii) By looking at the histogram, write the interval in which mode of the data lies. Explain your answer. Frequency
The following histogram represents the number of children visiting the park in evening at different time intervals: y 50 45+ 40 35 30 25 20 15+ 10 4:30 5 5:30 6. 6:30 7 7:30 Time- Answer the following questions by looking at the histogram. i) How many children visited the park between 4 p.m. to 6 p.m.? ii) At what time the maximum number of children visited the park? iii) How many children visited the park before 7 p.m.? iv) How many children visited the park after 5 p.m.? v) What are the total number of children visited the park in the evening? vi) How many children visited the park before 4 p.m.? vii) By looking at the histogram, write the interval in which mode of the data lies. Explain your answer. Frequency

College Algebra (MindTap Course List)
12th Edition
ISBN:9781305652231
Author:R. David Gustafson, Jeff Hughes
Publisher:R. David Gustafson, Jeff Hughes
Chapter4: Polynomial And Rational Functions
Section4.6: Rational Functions
Problem 11SC: Find the mean hourly cost when the cell phone described above is used for 240 minutes.

Related questions
Question
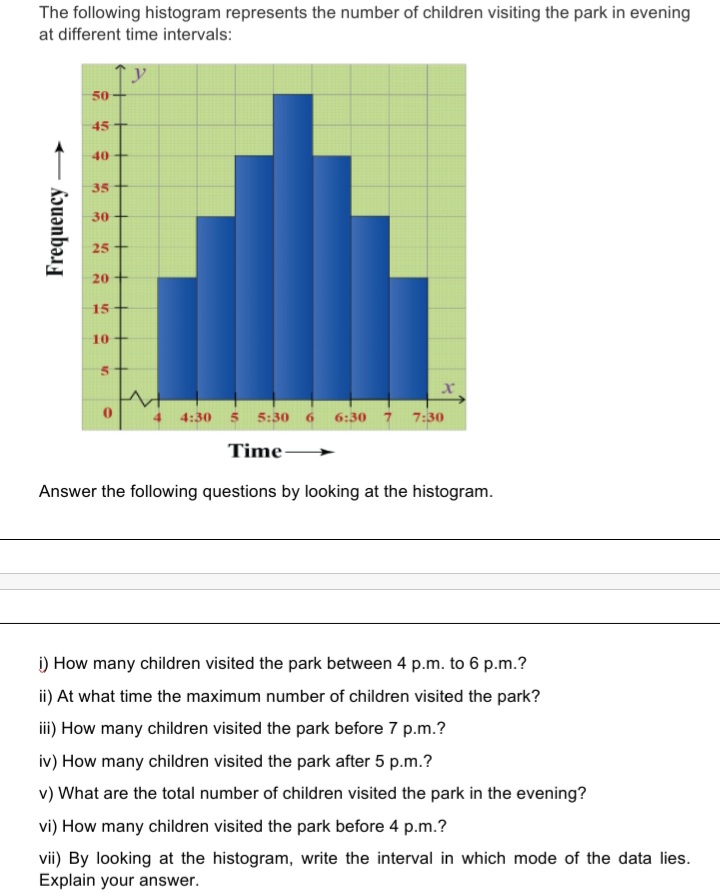
Transcribed Image Text:The following histogram represents the number of children visiting the park in evening
at different time intervals:
y
50
45+
40
35
30
25 +
20
15+
10
4:30 5 5:30 6
6:30 7
7:30
Time-
Answer the following questions by looking at the histogram.
i) How many children visited the park between 4 p.m. to 6 p.m.?
ii) At what time the maximum number of children visited the park?
iii) How many children visited the park before 7 p.m.?
iv) How many children visited the park after 5 p.m.?
v) What are the total number of children visited the park in the evening?
vi) How many children visited the park before 4 p.m.?
vii) By looking at the histogram, write the interval in which mode of the data lies.
Explain your answer.
Frequency
Expert Solution
This question has been solved!
Explore an expertly crafted, step-by-step solution for a thorough understanding of key concepts.

This is a popular solution!

Trending now
This is a popular solution!

Step by step
Solved in 3 steps

Knowledge Booster


Learn more about
Need a deep-dive on the concept behind this application? Look no further. Learn more about this topic, statistics and related others by exploring similar questions and additional content below.Recommended textbooks for you
College Algebra (MindTap Course List)
Algebra
ISBN:
9781305652231
Author:
R. David Gustafson, Jeff Hughes
Publisher:
Cengage Learning
College Algebra (MindTap Course List)
Algebra
ISBN:
9781305652231
Author:
R. David Gustafson, Jeff Hughes
Publisher:
Cengage Learning